The Basics & The Gaps - Shipping
The Basics & The Gaps is the Future Cleantech Architects flagship series of factsheets and animations which aims to summarise the key facts and figures on some of the most challenging issues and technological innovations needed to reach net-zero.
The Shipping Sector
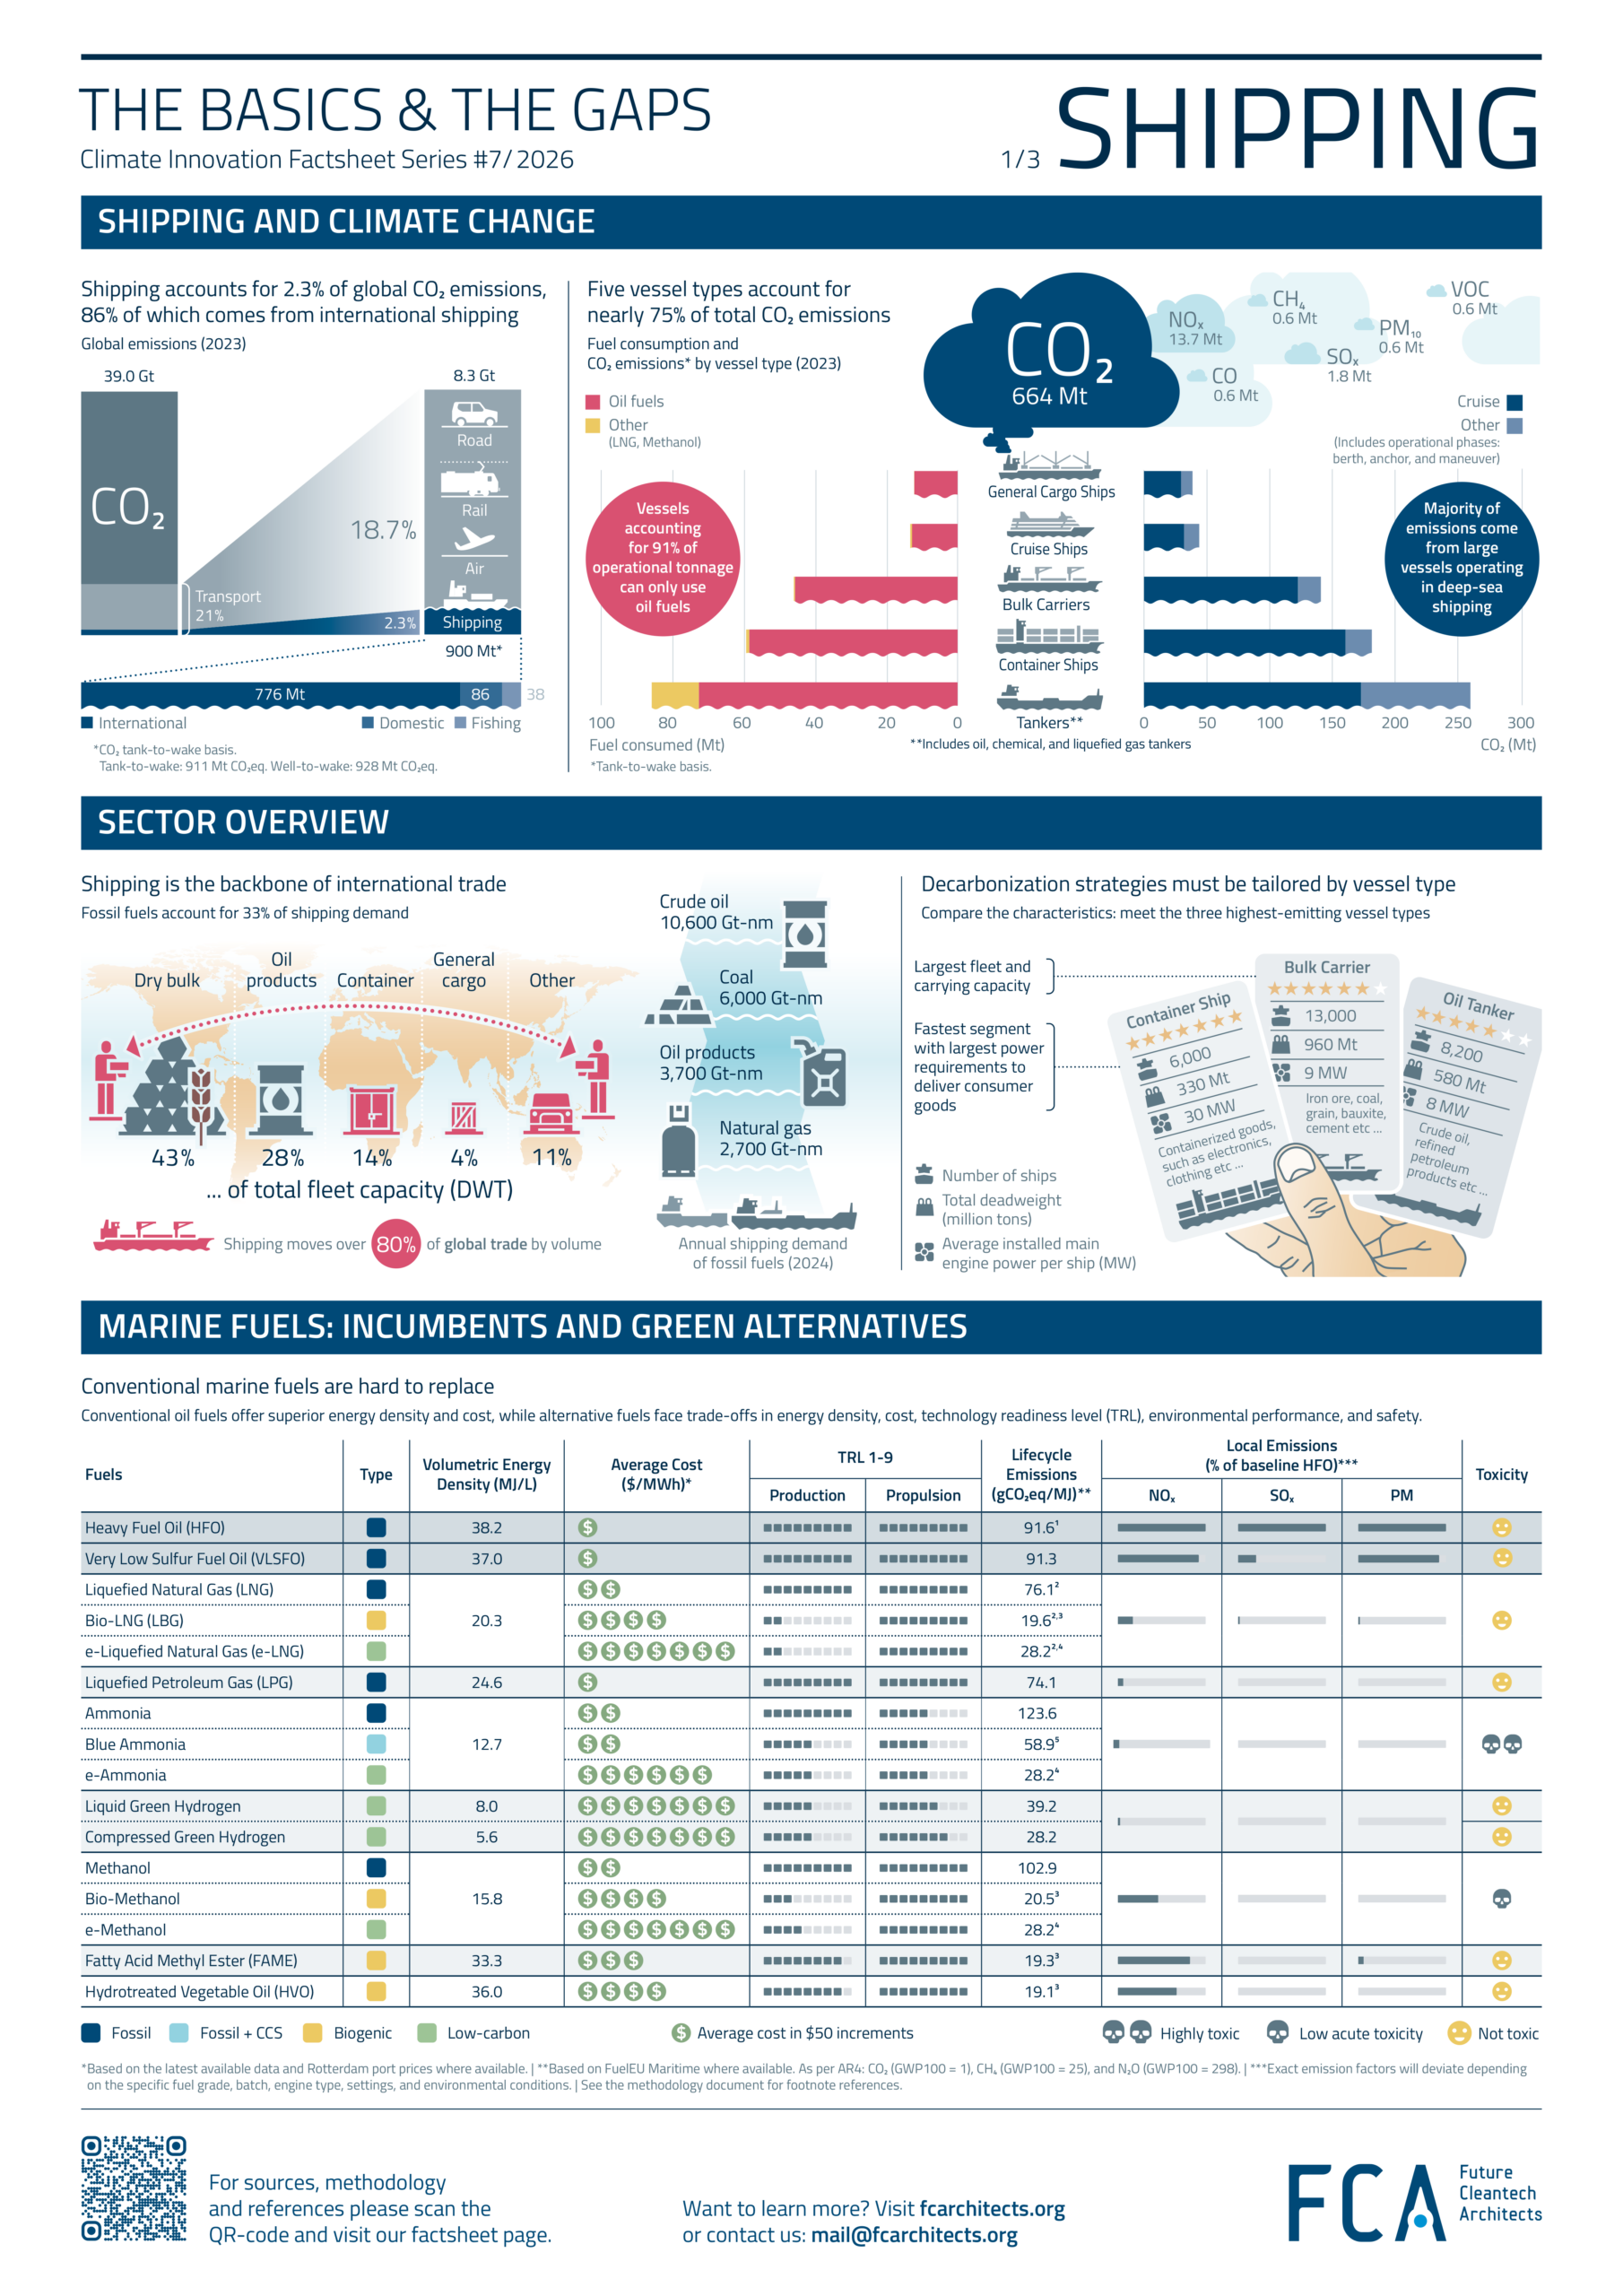
Shipping carries over 80% of global trade by volume. It accounts for 2.3% of global CO₂ emissions, 86% of which comes from international shipping. Today, roughly 90% of the fleet runs on oil-based fuels. Reducing shipping’s emissions starts with understanding where they come from. Five vessel types – general cargo ships, cruise ships, bulk carriers, container ships, and tankers – account for nearly 75% of total CO₂ emissions from shipping (mostly during cruising operations), even though they represent only part of the global fleet. As with other hard-to-abate sectors, there is no single technology that can decarbonize shipping. The right technology depends on vessel type, route, and power requirement.
Two key takeaways standout:
- Count the fleet, not the fuel: ships representing 91% of today’s operational tonnage can only run on oil-based fuels, so the debate over LNG, methanol, or ammonia often starts in the wrong place. Before asking which fuel will win, we should ask how much fuel will actually be needed. That means first electrifying the vessel types and routes where it makes sense, then cutting energy demand across the rest of the fleet through efficiency improvements, shore power, and wind-assisted propulsion systems. Only then should molecules be compared to meet the remaining liquid-fuel demand, and the smaller that demand, the faster and cheaper the transition becomes.
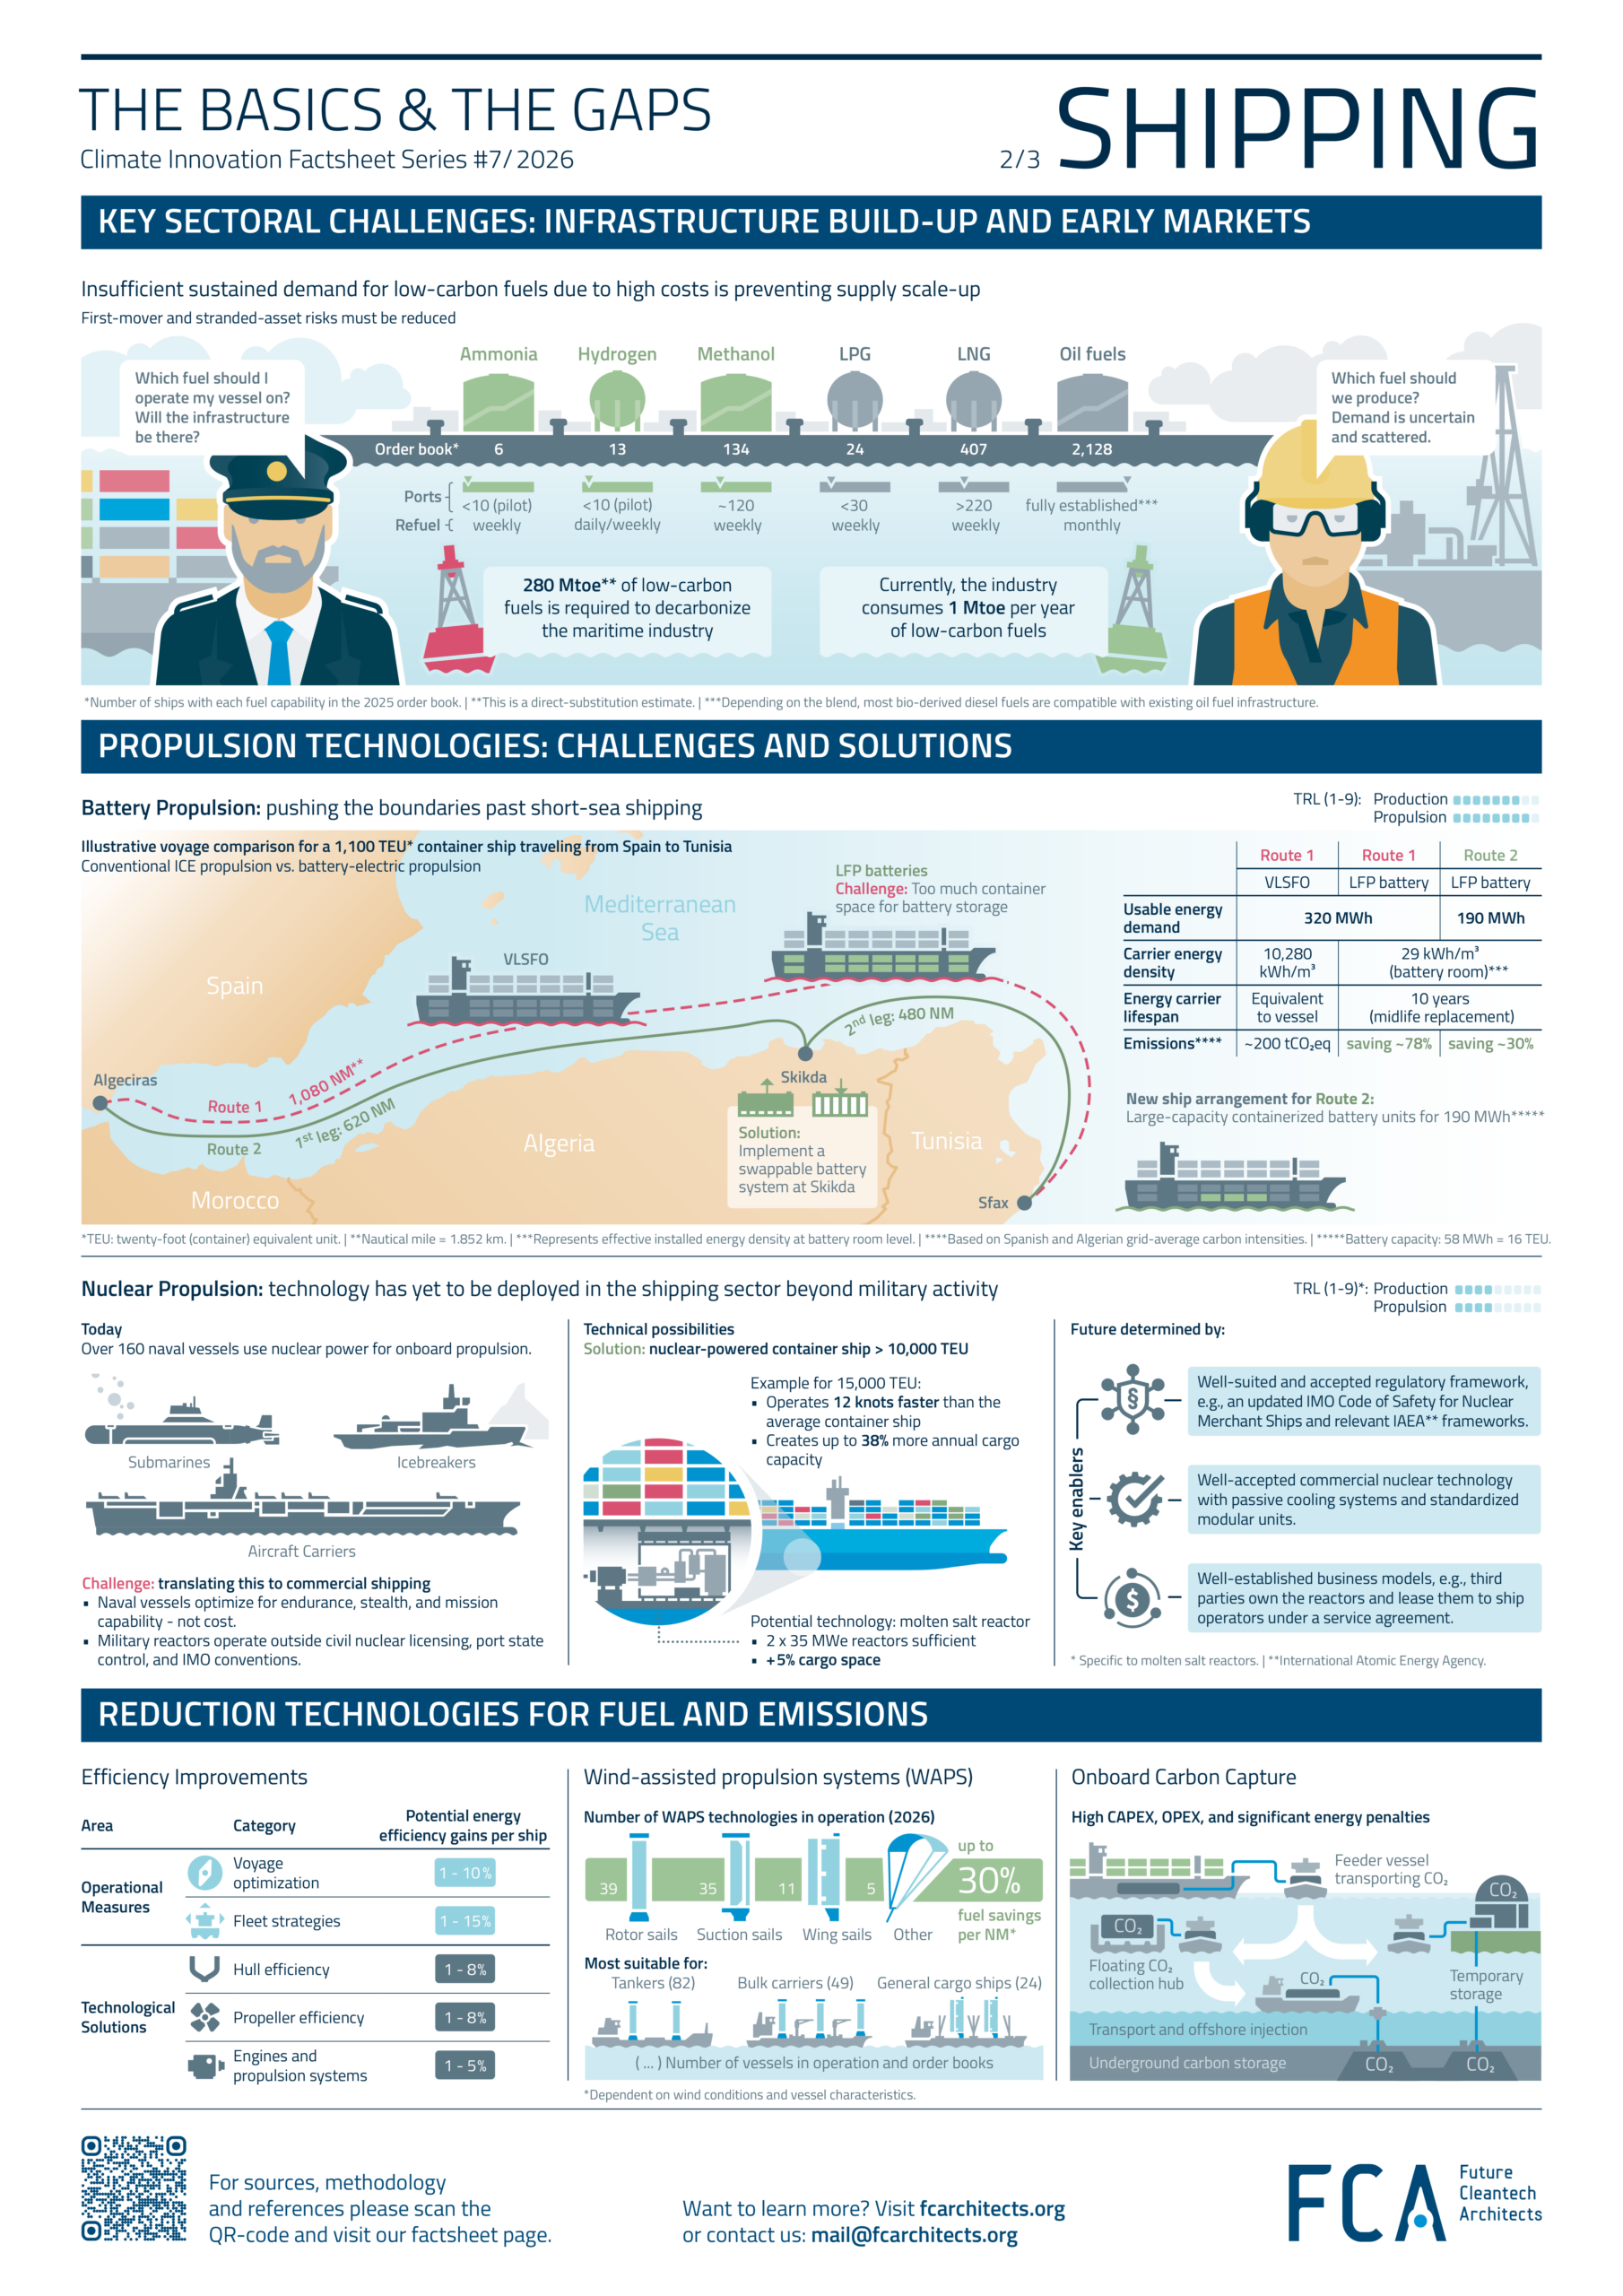
- Coordination is key: decarbonizing the sector is currently a chicken-and-egg problem. Fuel producers need to know vessels will buy green fuels before they invest. Shipowners need those fuels to be available before they order new vessels, and ports need to build the bunkering infrastructure that connects the two. If all three move together, they reduce first-mover and stranded-asset risks.
Read below our factsheet on shipping for an overview of everything you need to know about the sector and climate change, the challenges, and possible solution pathways.
Shipping Factsheet Sources/ Methodology
Glossary
Alternative fuels: fuels that require a different energy converter technology from conventional fossil fuel oils (like LNG, LPG, methanol, ammonia, hydrogen) regardless of WtW GHG intensity.
Anchor: refers to vessels waiting offshore with engines and/or generators running while not berthed.
Berth: a designated location in a port where a vessel is moored for loading, unloading, or servicing.
Bunkering: the process of supplying fuel to a ship.
Cargo owners: companies that own the goods being transported by ship and pay for their movement.
Deep-sea shipping: shipping operations over long international distances, typically across oceans between continents.
Drop-in fuel: a fuel that can be used in existing engines and infrastructure with little or no modification.
Dual-fuel engine: an engine capable of operating on two different types of fuel, typically a conventional fuel and an alternative fuel.
Gross tonnage: a measure of a ship’s internal volume (Gt).
Low-carbon fuels: as per the European Parliament, fuels that are at least 70% below the unabated fossil fuel comparator of 94 gCO2e/MJ, i.e., below 28.2 gCO2e/MJ.
Maneuver: the phase of vessel operation in confined waters, such as during docking, undocking, or port navigation.
Nautical mile: a unit of measurement (NM) for distance used in marine navigation, defined as exactly 1.852 meters.
Ship operators: entities responsible for the day-to-day operation and management of a vessel, including crew, maintenance, and voyage planning.
Shipowners: entities that own the vessel and are responsible for its financing and long-term investment decisions.
Shore power (cold ironing): the use of onshore electricity to power a ship while at a berth, allowing engines to be turned off and reducing emissions in port.
Short-sea shipping: shipping over relatively short distances, typically within a region or between neighboring countries.
Slow steaming: the practice of operating a ship at reduced speeds to lower fuel consumption and emissions.
Tank-to-wake (TtW): greenhouse gas emissions produced during the use of fuel onboard a vessel.
Twenty-foot equivalent unit (TEU): a standard unit used to measure container capacity, based on a 20-foot shipping container.
Total deadweight tonnage (DWT): the maximum weight a ship can carry, including cargo, fuel, crew, and provisions.
Volumetric energy density: the amount of energy stored per unit volume of a fuel, important for onboard fuel storage requirements.
Well-to-wake (WtW): total greenhouse gas emissions across the full lifecycle of a fuel, including production, transport, and use onboard a vessel.
Methodology / Sources
[1] Shipping accounts for 2.3% of global CO₂ emissions, 86% of which comes from international shipping
Total global CO2 emissions 2023, 39,042 Mt CO2. Total global shipping CO2 emissions 2023, 900 Mt CO2 (2.3% of global CO2 emissions). Breaking it down by sector: international shipping 776 Mt CO2, domestic shipping 86 Mt CO2, fishing 39 CO2: ICCT, “Greenhouse gas emissions and air pollution from global shipping, 2016–2023” (page 10, table 5).
Global transport CO2 emissions 2023, 8.34 Gt CO2 (21% of total global CO2 emissions): Statista, “Carbon dioxide emissions from the transportation sector worldwide from 1970 to 2023”.
[2] Five vessel types account for nearly 75% of total CO₂ emissions
Total CO₂ emissions from top seven emitting vessel types derived from supplementary data provided alongside ICCT, “Greenhouse gas emissions and air pollution from global shipping, 2016–2023” (page 11, figure 4).
Total CO₂ emissions per vessel type: container ships 181.19 Mt CO2, bulk carriers 140.61 Mt CO2, oil tankers 129.54 Mt CO2, chemical tankers 67.55 Mt CO2, liquefied gas tankers 63.22 Mt CO2, general cargo ships 38.38 Mt CO2, and cruise ships 43.05 Mt CO2.
When merging all tankers (chemical, liquefied gas, and oil) together: 260.31 Mt CO2
Share of CO2 emissions by phase of operation for top seven emitting vessels: ICCT, “Greenhouse gas emissions and air pollution from global shipping, 2016–2023” (page 11, figure 5).
| Berth | Anchor | Maneuver | Cruise | |
| General Cargo Ship | 7.99% | 14.22% | 1.68% | 76.11% |
| Cruise Ship | 15.35% | 10.82% | 1.92% | 71.92% |
| Liquefied Gas Tanker | 8.98% | 5.61% | 0% | 85.41% |
| Chemical Tanker | 33.19% | 9.40% | 0.70% | 56.71% |
| Oil Tanker | 28.21% | 8.93% | 0.56% | 62.30% |
| Bulk Carrier | 1.83% | 10.93% | 0.18% | 87.07% |
| Container Ship | 2.20% | 8.80% | 0.60% | 88.40% |
CO2 emissions by phase of operation (Mt)
| Cruise | Other | |
| Tankers | 173.0 | 87.3 |
| Container Ship | 160.2 | 21.0 |
| Bulk Carrier | 122.4 | 18.2 |
| Cruise Ship | 30.9 | 12.1 |
| General Cargo Ship | 29.2 | 9.2 |
Fuel consumption by top five emitting vessel types derived from supplementary data provided alongside ICCT, “Greenhouse gas emissions and air pollution from global shipping, 2016–2023” (page 14, figure 8).
Other emissions by top five emitting vessel types derived from supplementary data provided alongside ICCT, “Greenhouse gas emissions and air pollution from global shipping, 2016–2023”
NOx: 13,729,690 tons. SOx: 1,765,498 tons. PM10: 600,769 tons. CH4: 598,364 tons. VOC: 596,241 tons. CO: 594,941 tons.
[3] Shipping is the backbone of international trade
Shipping transports over 80% of world trade by volume: UNCTAD, Review of Maritime Transport 2021.
Percentage share of total deadweight tons – container (14.0%), oil tanker (28.3%), dry bulk (42.7%), general cargo (3.6%), other (11.5%): UNCTAD, Review of maritime transport 2024 (page 37, figure II. 3)
Transporting fossil fuels accounts for 33% of shipping demand: DNV, Global Energy Transition Outlook 2025 (page 31, figure 2.11)
[4] Decarbonization strategies must be tailored by vessel type
Information for three vessel categories derived from supplementary data provided alongside ICCT, “Greenhouse gas emissions and air pollution from global shipping, 2016–2023”.
| Number of ships | Total deadweight (tons) | |
| Bulk Carrier | 12,816 | 963,733,956 |
| Container ship | 5,836 | 328,708,062 |
| Oil Tanker | 8,188 | 579,578,494 |
Values above are rounded in factsheet.
Average main engine power per ship (kW) = total installed main engine power (kW) / number of ships:
Bulk Carrier: 119,893,698 kW/12,816 ships = 9,355 kW (≈9 MW)
Container Ship: 169,427,061 kW/ 5,836 ships = 29,031 kW (≈30 MW)
Oil Tanker: 68,199,914 kW/ 8,188 = 8,329 kW (≈8 MW)
[5] Marine fuels
Volumetric energy densities for each fuel based on a few resources: The Engineering ToolBox, IMO, and ICCT. Liquid green hydrogen volumetric energy density (8 MJ/L): US Department of Energy, Hydrogen Storage
Cost of each fuel: fuel costs are based on the latest available data, using Rotterdam port prices where available, and adjusted to 2025 terms using an inflation index. The factsheet reports the average value, rounded up to the nearest $50.
| Fuel | Price ($/MWh) | Source Year | Adjusted Price Range for 2025 | Source | Notes |
| HFO | 30 - 44 | 2025 | - | Rotterdam Bunker Prices - Ship & Bunker Jan 1 2025 - Jan 1 2026 | IFO380 Converted to USD/MWh with LHV 40 MJ/kg ICCT p. 8 |
| VLSFO | 33 - 48 | 2025 | - | Rotterdam Bunker Prices - Ship & Bunker Jan 1 2025 - Jan 1 2026 | Converted to USD/MWh with LHV 41.8 MJ/kg ICCT p. 8 |
| LNG | 44 -75 | 2025 | - | Rotterdam Bunker Prices - Ship & Bunker Jan 2 2025 - Jan 2 2026 | Converted to USD/MWh with LHV 50 MJ/kg ICCT p. 8 |
| LBG | 99 - 215 | 2020 | - | CE Delft Table 34 | No adjustment to 2025, conservative value as it is estimate for 2030 |
| e-LNG | 264 | 2020 | 334 - 375 | ICCT Table 3 USD Inflation 2020-end of 2025: 26.1 % | Converted to USD/MWh with average exchange rate 2025 of 1 to 1.13 Exchange rate statistics Upper range for 2025 taken from CE Delf, estimate because cost value is for 2030 |
| LPG | 44 - 49 | 2024 | 47 - 52 | Argus International LPG 2023 Argus International LPG 2024 USD Inflation 2024-End of 2025: 5.7 % | For ARA Covering Butane and Propane Converted to USD/MWh with LHV 45 MJ/kg IEA |
| Ammonia | 21 - 66 | 2020 | 26 - 83 | Text: 110 – 340 USD/t USD Inflation 2020-End of 2025: 26.1 % | Converted to USD/MWh with LHV 18.6 MJ/kg IRENA Table10 |
| Blue Ammonia | 41 - 95 | 2020 | 52 - 120 | Figure 4 USD Inflation 2020-End of 2025: 26.1 % | |
| e-Ammonia | 139 - 271 | 2020 | 175 - 342 | Figure 4 USD Inflation 2020-End of 2025: 26.1 % | |
| Liquid Green Hydrogen | 195 - 450 | 2023 | 215 - 495 | p. 80 4,5 -12 USD/kg for liquefying extra 2- 3 USD/kg USD Inflation 2023-End of 2025: 10.1 % | Converted to USD/MWh with LHV 120 MJ/kg IRENA Table10 |
| Compressed Green Hydrogen | 165 - 405 | 2023 | 182 - 446 | p. 80 4,5-12 USD/kg For compressing extra 1- 1.5 USD/kg USD Inflation 2023-End of 2025: 10 .1% | Converted to USD/MWh with LHV 120 MJ/kg IRENA Table10 |
| Methanol | 49 - 84 | 2025 | - | Rotterdam Bunker Prices - Ship & Bunker Jan 1 2025 – Dec 31 2025 | Converted to USD/MWh with LHV 19.9 MJ/kg IRENA Table10 |
| Bio-methanol | 167 - 205 | 2025 | - | For ARA Converted to USD/MWh with LHV 19.9 MJ/kg IRENA Table10 | |
| e-Methanol | 148 - 429 | 2020 | 187 - 541 | Figure 4 USD Inflation 2020-end of 2025: 26.1 % | |
| FAME | 92 - 116 | 2025 | - | For ARA Pure FAME Converted to USD/MWh with LHV 37 MJ/kg | |
| HVO | 129 -210 | 2025 | - | For ARA Converted to USD/MWh with LHV 44.1 MJ/kg |
Technology Readiness Level (TRL) of all fuels assessed in terms of production and propulsion: Lloyd's Register, Zero Carbon Fuel Monitor
The production stage includes all processing of resources and intermediate products used to create fuels. Propulsion covers all operations onboard (internal combustion engines - including dual fuel).
The numbers on the factsheet are based on the following scale:
- Basic principle observed
- Technology concept formulated
- First assessment feasibility concept and technologies
- Validation of integrated prototype in test environment
- Testing prototype in user environment
- Pre-production product
- Low scale pilot production demonstrated
- Manufacturing fully tested, validated and qualified
- Production and product fully operational
Lifecycle emissions based on values from the FuelEU Maritime Regulation (Regulation (EU) 2023/1805 on the use of renewable and low-carbon fuels in maritime transport): European Union, FuelEU Maritime.
Lifecycle emissions of blue ammonia depend heavily on carbon capture rate and upstream CH₄ and CO₂ leakage: FCA, Methodology for assessing greenhouse gas emissions savings from low-carbon fuels (page 25, Figure 2).
Lifecycle emissions for liquid green hydrogen based on: Nature Energy, "Worldwide greenhouse gas emissions of green hydrogen production and transport".
Other emission values (nitrogen oxides, sulfur oxides, and particulate matter) originate from Sustainable Ships, Fuel Properties and Cost Guide (page 27, table 10). This table is based on values found on IMO MEPC documentation and ISO marine fuel standards (e.g., ISO 8217), U.S. EPA AP-42 emission factors for combustion sources, and engine manufacturer documentation and test data (MAN Energy Solutions, Wärtsilä).
The values on the factsheet are converted to percentages, with HFO as the baseline reference.
Toxicity of fuels is based on the following sources: Sea-lng, "Comparison of Alternative Marine Fuels", Cleaner Logistics and Supply Chain, "Review of the state-of-the-art of alternative marine fuels: A viable approach to zero-carbon shipping",
[6] Insufficient sustained demand for low-carbon fuels due to high costs is preventing supply scale-up, while global port infrastructure needs to remain aligned with the fuel transition.
Hydrogen and renewable electricity required to produce low-carbon fuels. To produce a 10% share of e-fuels in the shipping sector by 2030, an estimated 70 Mt/yr of either e-ammonia or e-methanol would be needed. This is 3.5x the current global traded volume of ammonia or 2x the traded volume of methanol: IEA, The Role of E-fuels in Decarbonising Transport.
600 TWh of extra renewable electricity and 13 Mt hydrogen is required to produce this volume of e-fuels in 2030: HydrogenInsight, How much green hydrogen and renewable energy will be needed to decarbonise global shipping?
In 2024, the EU produced 2,828 TWh of electricity, over 48% of electricity came from renewable sources (1,357 TWh): European Council, How is EU electricity produced and sold?. Therefore, an additional 600 TWh electricity means 45% more renewable electricity generation is required from Europe.
Current EU hydrogen consumption is 7.8 Mt (2024): Clean Hydrogen Monitor, 2025.
This would increase total shipping cost by 75% per tone-km and on average would cost an added $250/TEU: IEA, The Role of E-fuels in Decarbonising Transport. Typical freight rate: $800-1,000/TEU: UNCTAD, Review of Maritime Transport 2023. Typical goods value: $30k-60k/TEU. Therefore, a $250/TEU increase would represent <1% of the value of transported goods. Very small impact on consumer: translates to < $0.01 per avocado or iPhone and around $1.50 to a solar panel module (2m x 1m).
[7] Battery Propulsion
Illustrative voyage comparison: A 1,100 TEU containership powered by a conventional VLSFO internal combustion engine versus battery-electric propulsion, operating between the Strait of Gibraltar and Sfax, Tunisia - a route of roughly 1,000 nautical miles. The exact route is not shown on the factsheet as this is just an illustration, and the ships are not to scale.
The voyage corresponds to an estimated at-sea energy demand of up to 320 MWh. Battery case assumptions: Based on a non-optimised design aligned with 2024 classification society and vendor requirements, assuming 50 MWh installed battery capacity. The resulting battery room volumetric energy density is 29 kWh/m3 (=0.1044 MJ/L). Mærsk Mc-Kinney Møller Center for Zero Carbon Shipping, Understanding the potential of battery-electric propulsion for cargo vessels, 2024 (Page 20, Figure 6).
The average lifespan of a containership is 24 years: 2024, Environmental consequences in lifecycle changes of container shipping vessels. Current marine industry practice assumes a battery lifetime of roughly 10 years, though this varies by battery type and charging profile. As a result, one midlife battery replacement required: MAN Energy Solutions, Batteries on board ocean-going vessels
Electric vehicle average lithium-ion battery pack and cell price split in 2023: $139/kWh (cell $107/kWh and system $32/kWh): BloombergNEF, Lithium-Ion Battery Pack Prices Hit Record Low of $139/kWh. In marine-grade battery systems, the cells account for about 40% of total system cost: MAN Energy Solutions, Batteries on board ocean-going vessels. Even if cell prices fell by 75% from today’s levels, the overall battery system cost would decline by only around 30%. Several of the most detailed recent merchant shipping studies modelled battery system costs in the $300 to $500 per kWh range: Most Maritime Shipping Battery Propulsion Studies Are Already Obsolete
Scenario 1: VLSFO (conventional diesel engine)
Fuel consumed is derived from the engine's specific fuel oil consumption (SFOC):
Fuel mass = Energy demand × SFOC
= 320,000 kWh × 185 g/kWh
= 59.2 tonnes VLSFO
SFOC assumption: 185 g/kWh is a typical value for a slow-speed two-stroke marine diesel engine running on VLSFO (manufacturer data from MAN Energy Solutions and Wärtsilä typically ranges 170–195 g/kWh depending on engine size and load).
CO2 emissions are then derived using the standard carbon conversion factor:
CO2 = Fuel mass × Cf
= 59.2 t × 3.114 tCO2/t
≈ 184 tonnes CO2 (tank-to-wake)
Cf = 3.114 tCO2 per tonne of fuel oil is the default emission factor set by the IMO Data Collection System (MEPC.1/Circ.896) and adopted in the EU MRV Regulation (EU) 2015/757, Annex I.
Sensitivity range (SFOC 170–195 g/kWh): ≈169 -194 tonnes CO2 (rounded to 200 t CO2)
Scenario 2: Battery-electric propulsion, charged in Spain
Grid electricity required = Energy demand/round-trip efficiency
= 320,000 kWh/0.81
= 395,060 kWh
Round-trip efficiency assumption: 76-85% efficiency from port to propeller. Average of 81% taken: https://www.sciencedirect.com/science/article/pii/S1364032125009736?via%3Dihub
Emissions are then calculated using Spain's 2024 grid average carbon intensity: https://ourworldindata.org/profile/co2/spain
CO2 = Grid electricity required × grid emission factor
= 376,500 kWh × 156 gCO2/kWh
≈ 61.6 t CO2
234,567
36.6t
59.6t
96.2
https://ourworldindata.org/profile/co2/algeria
Algeria is 254 g CO2/kWh
Efficiency improvement
WAPS
WAPS technologies chosen for ships in operation: DNV, Maritime Forecast to 2050 (2026).
Most suitable for tankers, bulk carriers, and general cargo ships: DNV, Maritime Forecast to 2050 (2026). (FIGURE 3-7, page 30)
On board carbon capture
Significant energy penalties in the range of 15-30 % and up to 10 % cargo loss for studied container ships: https://www.sciencedirect.com/science/article/pii/S0301479725036539
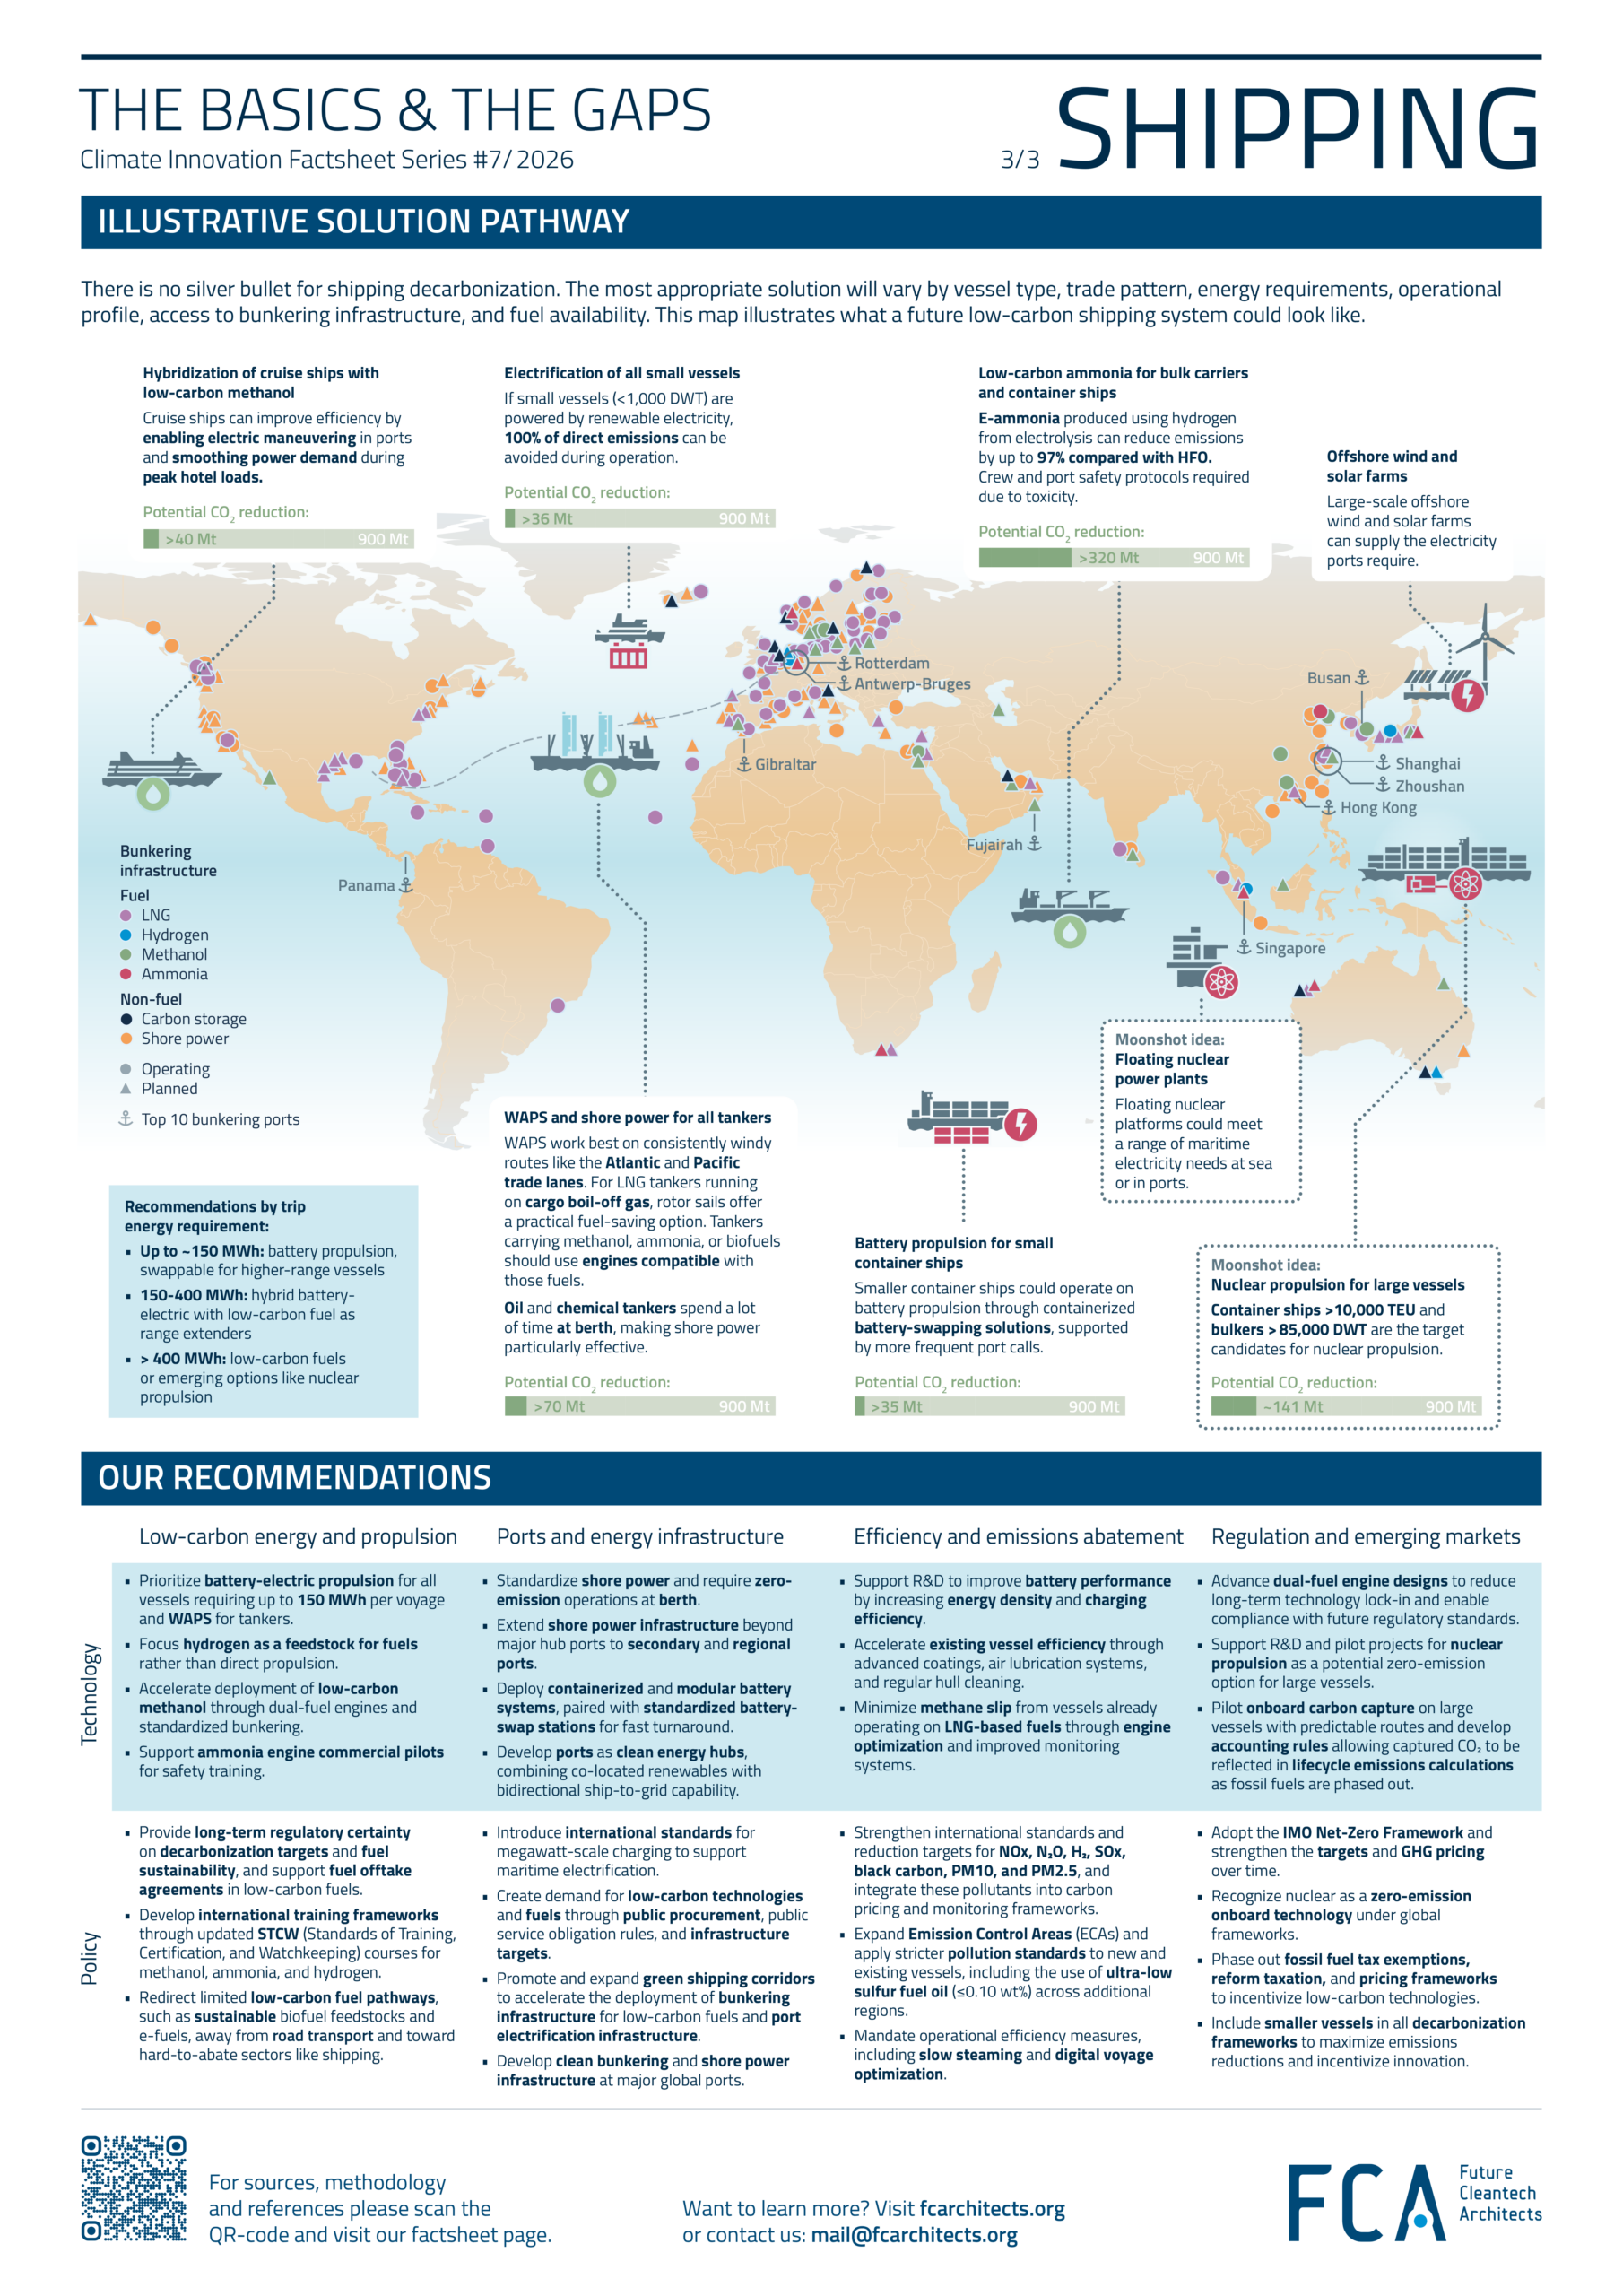
Illustrative Solution Pathway
Potential CO2 reduction is based on a tank-to-wake basis for all recommendations.
- Hybridization of cruise ships with low-carbon methanol
Renewable methanol can reduce CO2 emissions by up to 95%, depending on the methanol production process: https://www.sciencedirect.com/science/article/pii/S0016236125003576
Cruise ships emit around 43.05 Mt CO2 a year and 28.1% of these emission come from the operational phases: maneuver, berth, and anchor: ICCT, “Greenhouse gas emissions and air pollution from global shipping, 2016–2023”. In this case, ~30% of emissions could be reduced if these operational phases were handled with batteries.
Total combined savings:
Battery (maneuver/berth/anchor): 12.10 Mt CO2 saved
Methanol (cruising): 29.40 Mt CO2 saved
Total: ~40 Mt CO2 saved
- Electrification of all small vessels
Small vessels, those with a DWT below 1,000, make up 13% of the global fleet but account for only 4% of total shipping CO2 emissions (36 Mt CO2 per year): https://www.sciencedirect.com/science/article/pii/S1364032125009736?via%3Dihub
Given their limited size and power demands, these vessels are well suited to full electrification, which would eliminate tank-to-wake carbon emissions entirely.
Their full lifecycle emissions, however, would still depend on two factors: the emissions associated with battery production, and the carbon intensity of the grid used to charge them
- Low-carbon ammonia for bulk carriers and container ships
e-ammonia derived from hydrogen produced via electrolysis can achieve emissions reductions of up to 97% compared to heavy fuel oil if it is certified as a renewable fuel of non-biological origin (RFNBO): Mærsk Mc-Kinney Møller Center for Zero Carbon Shipping, "FuelEU Explainer: Fuel Certification Essentials".
However, tank-to-wake CO2 emissions are zero as ammonia contains no carbon atoms. Total emissions from bulk carriers and container ships are 321 Mt CO2: ICCT, “Greenhouse gas emissions and air pollution from global shipping, 2016–2023”.
Therefore, e-ammonia could reduce tank-to-wake CO2 emissions by ~320 Mt if container ships and bulk carriers are converted to this fuel.
Today, however, over 96% of global hydrogen used to produce ammonia still comes from fossil sources. The dominant pathway - accounting for more than 70% - is steam methane reforming (SMR), which uses natural gas as feedstock and emits an estimated 2.5-2.9 kg CO2e / kg of NH3 produced: KAUST, "Blue and Green Ammonia Production: A Techno-Economic and Life Cycle, Assessment Perspective". In addition, there is currently no dedicated large scale e-ammonia supply for shipping today.
- WAPS and shore power for all tankers
Chemical, oil, and liquefied gas tankers emit 64.6Mt CO2 at berth: ICCT, “Greenhouse gas emissions and air pollution from global shipping, 2016–2023”. These emissions could be reduced if all tankers connected to shore power. Oil and chemical tankers, specifically, generate a comparatively larger share of their emissions while at berth or anchor than other vessel types, largely due to the high energy demands of loading and unloading cargo.
Chemical, oil, and liquefied gas tankers emit 173 Mt CO2 during cruising operation. For LNG tankers, which use cargo boil-off gas as fuel and have little incentive to switch fuels, WAPS (rotor sails in particular) provide a practical way to reduce fuel consumption.
Based on the available data, WAPS savings vary considerably depending on ship design, route, and installation scale:
Reported average savings 4.5-9%: https://www.dnv.com/maritime/insights/topics/waps-wind-assisted-propulsion-systems/
173 Mt × (4.5%-9%) = 7.79 - 15.57 Mt CO2 saved
Total emissions savings: 72.4-80.3 Mt CO2 saved
- Battery propulsion for small container ships
- Moonshot idea: Nuclear propulsion for large vessels
the use of nuclear energy on large ocean-going vessels could result in a 98% reduction in CO2 equivalent emissions. https://c-job.com/news/nuclear-power-a-potential-game-changer-for-the-shipping-industry/
Containerships >10,000 TEU (904 vessels) are responsible for 8% of global shipping emissions (72 Mt CO2).
Bulkers >85,000 DWT (2,592 vessels) are responsible for 8% of global shipping emissions (72 Mt CO2).
If all of these ships operate on nuclear propulsion, 141 Mt CO2 could be avoided
The 2024 Global Top 10 Bunkering Ports, revealed at the 8th International Petroleum and Natural Gas Enterprises Conference (IPEC) in Zhoushan, collectively reached 111.93 million MT.
Highlights
The Heat Sector in Focus: Essential Applications and Clean Heat Sources
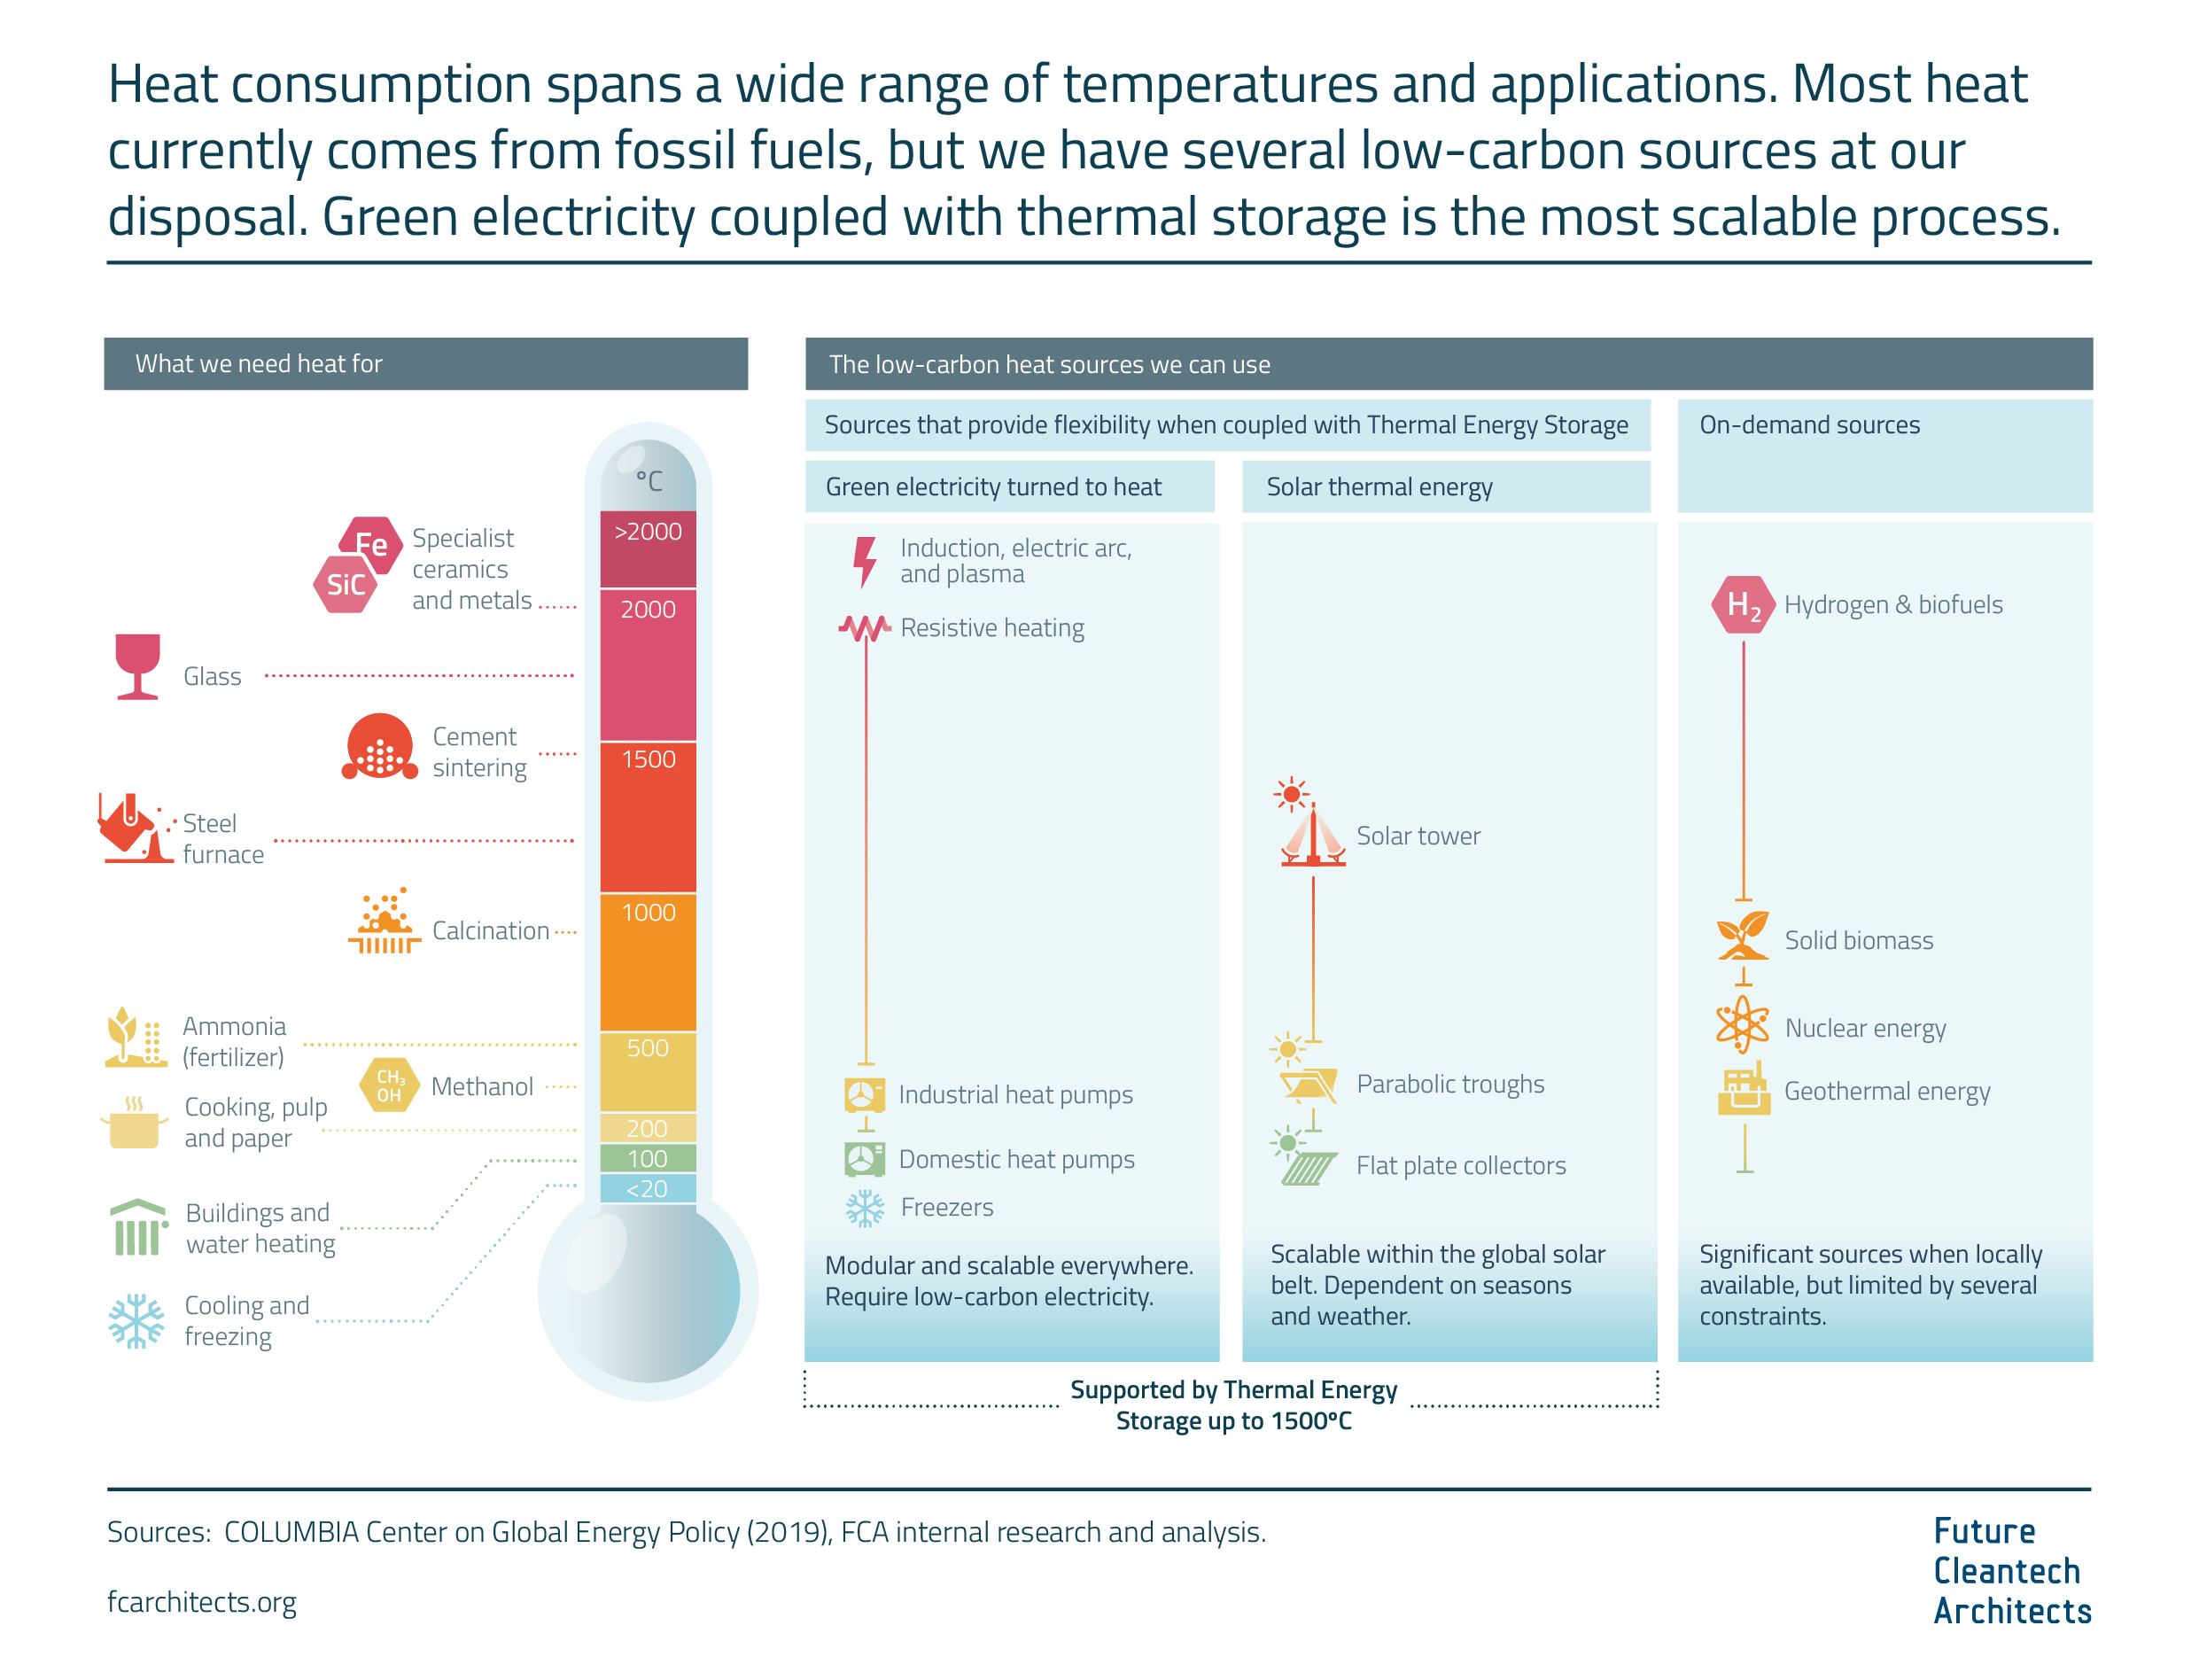
Heat consumption spans a wide range of temperatures, processes, and services, including in domestic and industrial settings. At low temperatures, large quantities of heat are needed to heat up buildings and hot water. At higher temperatures, heat is used for different industrial processes, from processing pulp and paper, and the manufacturing of chemicals to the manufacturing of cement, glass, and metals, with some processes requiring heat up to 2000ºC and above.
While most heat is currently generated by burning fossil fuels, several alternative low-carbon heat sources are at our disposal. Some of the low-carbon sources that can supply heat on demand are limited by several factors: such as geography (geothermal energy); political and social acceptance (nuclear energy); limited supply (biomass); and high cost, low efficiency, and lack of infrastructure (hydrogen).
On the other hand, solar thermal energy is a low-carbon source that is highly scalable within the global solar belt. While solar radiation is inherently dependent on the day/night cycle and weather variations, the integration with thermal storage makes solar thermal energy a flexible source able to supply heat around the clock.
However, the most universal and scalable low-carbon heat source is electrification, which consumes green electricity (e.g. from wind and solar photovoltaic plants) and turns it to heat via devices such as heat pumps (for heat up to 200ºC) and electric resistors (for industrial applications up to
almost 2000ºC). While heat pumps and resistors can inherently deliver heat on demand, the addition of thermal storage allows these devices to consume electricity at the most optimal times: when supply from solar and wind is high, and when the cost and the emissions are low. This provides the power grid with additional flexibility and stability and helps integrate larger shares of renewable energy.
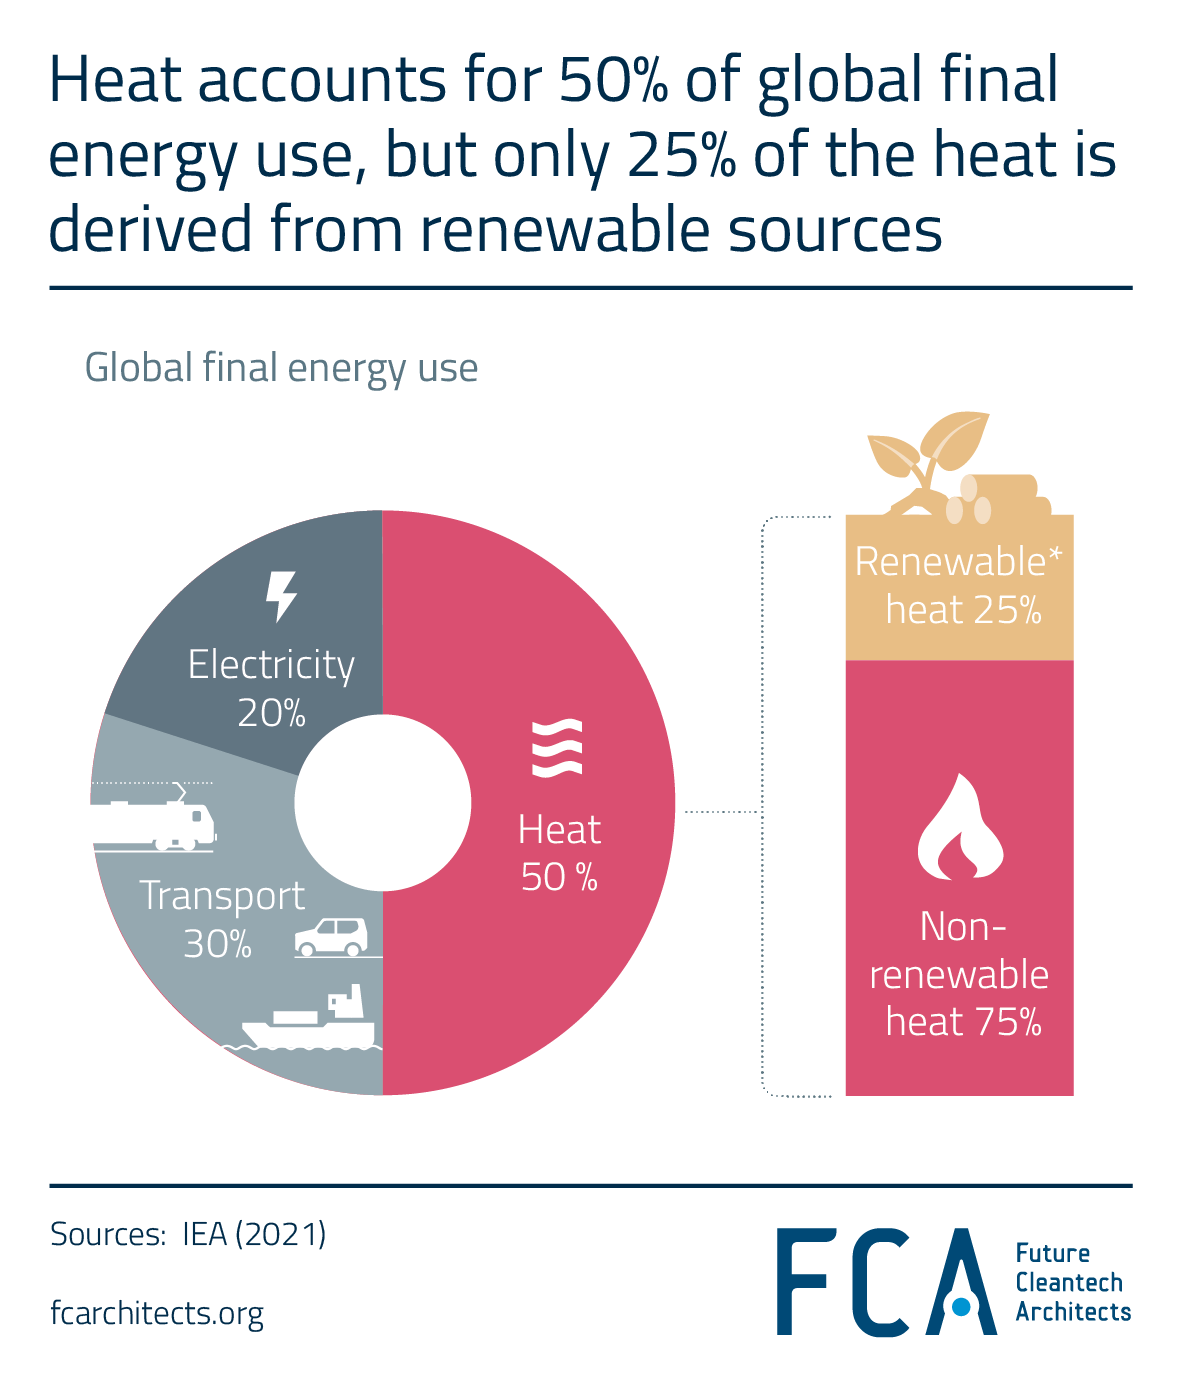
The heat sector plays a crucial role in the global economy and the energy transition: it accounts for 50% of global final energy use and over 25% of global greenhouse gas emissions.
However, we are a long way away from decarbonizing heat: currently, only 25% of global heat production is derived from renewable sources, and about half of that comes from traditional biomass usage in buildings.
The sheer size of the heat sector (including both industrial and domestic settings) and its emissions are often overlooked. Furthermore, the crucial role that thermal energy storage technologies can play in decarbonizing heat while providing extra flexibility to the whole energy system is also neglected. This can result in loss of critical funding.
To decarbonize heat as quickly as possible, we need to recognize the magnitude of the heat sector, prioritize its decarbonization within policy frameworks, and secure the necessary investment to scale up the deployment of energy efficiency measures and thermal energy storage technologies.

Thermal Energy Storage is more advanced than you think
While some Thermal Energy Storage technologies require further support for RD&D, many others are mature and ready to deploy.
Thermal Energy Storage is an efficient and cost-effective tool ready to support the growth in renewables. There is a multitude of TES technologies and materials, covering a wide range of temperatures, storage durations, and applications, in different stages of readiness.
Some of the most mature TES technologies include:
✅ Medium and high-temperature “sensible heat” storage tanks, containing liquid or solid thermal materials, that supply industrial heat.
In particular, thermal storage for steam generation at temperatures up to 500ºC is a mature and cost-effective technology that can store and supply heat for several hours or even days. For instance, the concentrated solar power (CSP) industry has deployed molten salt technology globally, exceeding 20 GWh of thermal storage installed by 2020, and is on track to double that by 2026.
✅ Low-temperature stores, that store and supply heat for several weeks or even months.
These include underground stores typically used to heat a single building or a small group of buildings, and large hot-water “pit reservoirs” used for district heating (with hot water up to 80-90ºC). These technologies have been successfully deployed for several decades, especially in northern European countries such as Denmark.
On the other hand, TES technologies that can store heat both at high temperatures and for very long durations, such as chemical heat storage, are still in early stages of development and require further support for research, development, and demonstration
Thermal Energy Storage (TES) can play a vital role in decarbonizing the heat sector
The size of the heat sector and its large impact on climate (over 25% of global greenhouse gas emissions) are often underestimated. Similarly, the important role that TES technologies can play in decarbonizing the sector tends to go unnoticed.
Thermal Energy Storage captures different intermittent energy sources in the form of heat, which is then available on demand for different applications (including in buildings and industrial settings). TES can be coupled with several low-carbon heat sources, such as wind and solar electricity that has been turned to heat (or “direct electrification”), solar thermal, and geothermal energy. It can also help reuse waste heat from industrial processes.
TES also facilitates renewable integration, mitigating curtailment, and expanding the availability of heat during periods of low renewable supply. By decoupling supply and demand, it favors the consumption of cleaner, low-cost electricity, increasing energy flexibility, energy efficiency, and energy security.
Multiple TES technologies are available, covering a wide range of temperatures, storage durations, and applications. While some of these technologies still require further support for RD&D, many others are ready to deploy and support the growth in renewable energies.