Aviation is the fastest-growing emitter in the transport sector. However, why is it so hard to get the sector on a more sustainable path? What technological alternatives are available? What would a holistic solution pathway look like?
The Basics & The Gaps - Aviation
The Basics & The Gaps is the Future Cleantech Architects flagship series of factsheets and animations which aims to summarise the key facts and figures on some of the most challenging issues and technological innovations needed to reach net-zero.
Aviation


Show Methodology & Sources
Methodology
[1] Transport sector emissions
Share of global CO2 emissions from the aviation sector in 2019 was around 1.04 Gt CO2, retrieved from the International Energy Agency (IEA), Transport (CO2 emissions section). This is equivalent to 2.5% of the ~41.64 Gt global CO2 emissions in 2019 from fossil fuel and land use change, and 2.8% of the 37.08 Gt from fossil fuel use alone. Global CO2 emissions for the year 2019 were retrieved from Our World in Date, CO2 emissions (2022).
Distribution of CO2 emissions from the transport sector in 2019 (~8.26 Gt) from IEA (2022). Breakdown of transport emissions into road transport (around 5.95 Gt), shipping (0.87 Gt), rail (0.1 Gt), pipeline (0.3 Gt). This data was retrieved from IEA, Transport (CO2 emissions section.)
[2] Demand and emissions projections
Demand and emissions projections for commercial aviation passenger travel to 2050 in billion passenger-km and MtCO2 respectively, were retrieved from the Transport Outlook 2023 by the International Transport Forum (ITF) (2023). The data for both demand and emissions were made available on the ITF Transport Outlook statistics database. The data used were for the ITF’s current ambition scenario that projects the impact of current policies on demand and emissions to 2050.
[3] Non-CO2 emissions
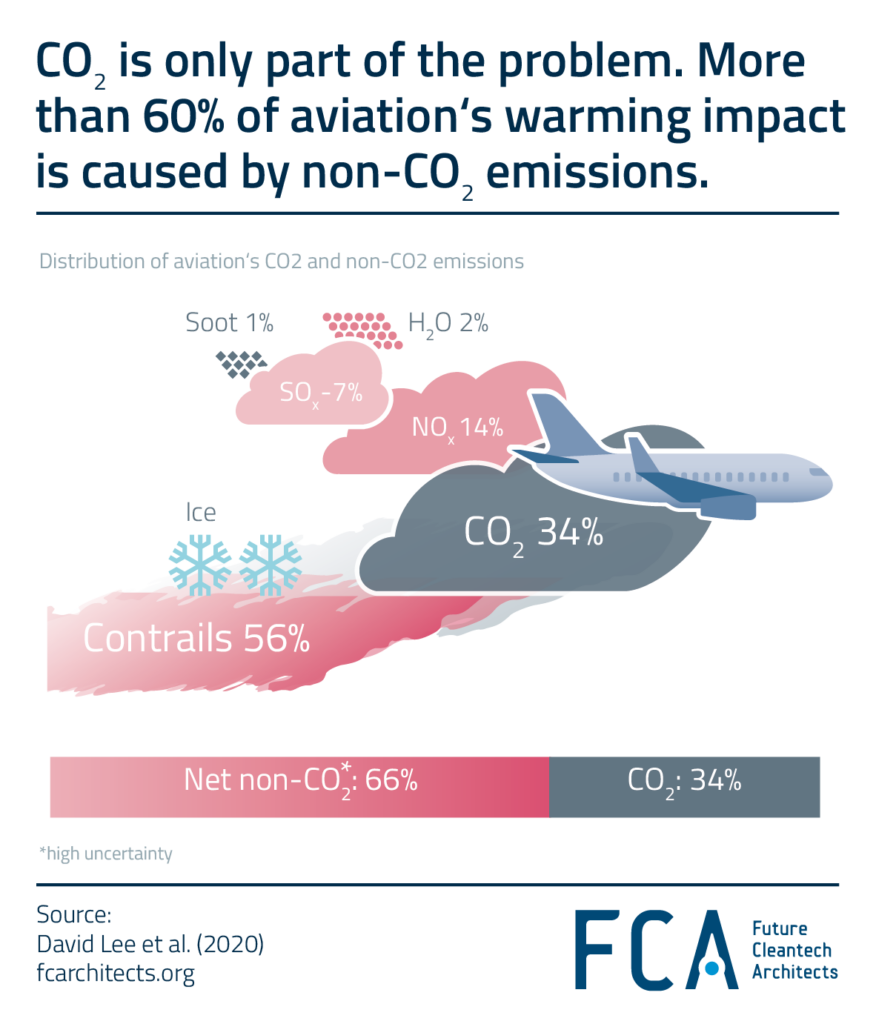
The warming impact (effective radiative forcing) of CO2 and various non-CO2 emissions (contrails, net-NOx, SOx, soot, water vapor) and their uncertainties were retrieved from David Lee et al. (2020)(Figure 3) and converted into percentages. NOx here refers to net-NOx or total-NOx, which factors in aviation NOx photochemical effects on O3 and CH4
Contrails here is used to refer to long-lived contrails that include both persistent contrails and contrail cirrus, which combined make up aircraft induced cloudiness (AIC). AIC is the largest contributor to aviation’s warming impact as detailed in Kärcher (2018).
[4] Jet fuel is hard to beat
Compiled based on our own elaborations of the characteristics of jet fuel when compared to alternatives.
Physical properties of jet fuel retrieved from Meredith Colket et al (2017)
To compare between alternative technologies and conventional jet fuel, the following were referred to:
Battery-electric flight information, particularly on battery specific energy density, retrieved from Andreas Schafer et al (2018)
Information on challenges in both hydrogen and electric aircraft retrieved from the Sustainable Aero Lab (2023)(sections 2.1 and 2.2).
Cost of alternative fuels and technologies relative to jet fuel are provided by the Aviation Impact Accelerator.
[5] Long-haul flights are hard to decarbonize
Share of long-haul flights at 5% and short to medium-haul flights at 95% from ITF (2021) (page 16, Figure 2).
Share of CO2 emissions for long-haul flights at ~38% and for short to medium-haul flights at ~62% for the year 2019 retrieved from the International Council on Clean Transportation (ICCT) (2020) (page 19, figure 9).
[6] International flights are hard to regulate
International flights make up 37% of all flights, but 60% of all emissions; while domestic flights make up 63% of all flights, but 40% of all emissions. Data retrieved for 2019 from ICCT (2020) (page 7, figure 2).
[7] Planes in operation are hard to replace
Information on aircraft lifespan retrieved from the Sustainable Aero Lab (2023) (Section 2.3).
[8] Key technical challenges
Sources for information on electric aircraft, hydrogen aircraft and SAFs:
Key challenges:
Battery-electric flight information, particularly on battery specific energy density, retrieved from Andreas Schafer et al (2018)
Information on challenges in both hydrogen and electric aircraft retrieved from the Sustainable Aero Lab (2023) (sections 2.1 and 2.2).
SAFs production from the International Air Transport Association (IATA) press release IATA (2022) on SAF production.
In-flight emissions data: from the Aviation Impact Accelerator.
Maximum range: from the Aviation Impact Accelerator. Additionally, compared against announced projects and targets by companies such as Heart Aerospace, ZeroAvia, and Airbus’ ZEROe.
Travel share:
Travel share was compared against Mission Possible Partnership (MPP) (2022) (Page 16). It must be noted that the number of flights and share of emissions are not interchangeable as was shown in section [5]. Here, the share of travel each technology could replace reflects the share of final energy demand, and thus emissions, each could replace, which is currently dominated by conventional flights.
To estimate the potential travel share of each technology, firstly, each technology was considered independently of the other. This means that for example if SAFs were the only alternative solution available, what is their potential to replace conventional-jet-fuel flights by 2050. Assumptions were made regarding entry into service and range limitations as follows:
- Battery-electric flights: these planes are still in the testing phase and restricted to smaller turboprop planes limited both in range and capacity.
- Range and capacity limitations are mainly due to battery weight and low specific energy density restrictions – keeping share of battery-electric travel to regional flights <500 km in range and <100 passenger capacity. This implies a travel share below 5.5% by 2050 (as 5.5% represents all travel under 500 km).
- All-electric aircraft are not commercially viable yet, which further restricts the potential travel share they can replace within this range by 2050. An ambitious ~2% travel share of all-electric aircraft by 2050 is assumed, if the uptake of all-electric aircraft is heavily accelerated and supported. This is similar to the ~2% share of final energy demand (travel share) in 2050 covered by all-electric aircraft made by MPP (2022).
- Hydrogen flights: while there is potential for longer-range hydrogen flights in the future, currently, hydrogen planes are still in the testing phase and restricted to smaller turboprop planes.
- Considering the range limitations from the Aviation Impact Accelerator and planned projects by companies such as ZeroAvia and Airbus’ ZEROe, hydrogen planes were assumed feasible up to 4000 km in range. This implies a travel share of 62% by 2050.
- However, entry into service and fleet renewal must be considered too, as commercial hydrogen flights are not yet available. The potential travel share is then dependent on year of entry and achievable range. A moderate entry into service (between 2035 and 2040) was assumed, which reduces hydrogen final travel share to 25% by 2050.
- SAFs were considered as drop-in fuels with no range limitations and a potential 100% travel share. N.B. for SAF flights, it is assumed that there are no tank-to-wake CO2 emissions.
All emissions data over the different ranges were retrieved from ICCT (2020) (page 19, figure 9), and the emissions distribution across the ranges was assumed to remain constant to 2050.
[9] Realistic technical potential
Technology Readiness Level (TRL) for each technology retrieved from the IEA, ETP Clean Energy Technology Guide (2023). TRL is defined on a scale of 1-9 where 1 represents the concept stage, 5 the large prototype stage, and 9 maturity. N.B. all SAFs are assumed as drop-in fuels.
Reduced warming per flight:
- This parameter represents the reduction in warming impact from in-flight emissions, including non-CO2 effects, as well as upstream ground and infrastructure emissions, on a 100-year basis, when an alternative technology is opted for in place of a conventional jet fuel flight.
- Thus, each reduction is relative to the total impact of a conventional flight.
- Data on the reduced warming impact is retrieved from the Aviation Impact Accelerator (section on total climate impact). In the Aviation Impact Accelerator, the total climate impact of each technology is given relative to the in-flight CO2 emissions of a conventional jet fuel flight.
- We converted this number to the reduced warming impact, which includes non-CO2 effects and upstream emissions, of each technology relative to the total impact of a conventional jet fuel flight.
- For each technology, the warming impact falls within a range based on uncertainties in both upstream and in-flight emissions. From this range, we then estimated the uncertainty associated with each technology: <15%, between 15% and 50%, and >50% were assumed as the cutoffs for low, medium, and high uncertainty.
Sector-wide reduced warming: Our own metric, calculated as the product of the reduced warming impact per flight and the potential travel share each technology could replace as detailed in [8].
[10] Avoiding
Rail data: 17% of regional flights under 750 km could be shifted to rail by 2050, leading to 2% emissions savings, retrieved from MPP (2022) (page 36). This is based on data from IEA (2021) (page 85) where regional flights are assumed to be those that take less than 1 hr (<750 km).
This was then expanded to an additional 17% of flights <1500 km that could be serviced by night rail (assuming these flights are on routes replaceable by rail):
- The emissions from flights between 750 km and 1500 km were retrieved from ICCT (2020) (page 19, figure 9).
- 17% of emissions within this range equates to an added emissions savings of 3.5% (assuming all flights have the same average carbon intensity within this range).
- Assuming the feasibility of 17% shift to night rail globally was compared against Back on Track EU (2022). This report shows that 33% of EU aviation operates on night rail replaceable routes. Therefore, a 17% global night rail assumption was considered reasonable relative to the EU context.
Therefore, total modal shift to rail and night rail could help eliminate ~5.5% of aviation CO2 emissions.
Frequent flyers data: data was retrieved from Stefan Gössling et al. (2020). It was shown that the most frequent flyers (at most 1% of the global population) are responsible for ~50% of all aviation related emissions annually. Thus, if they opt for alternative modes of travel and/or videoconferencing to shift 20% of the total distance they travel (not number of flights, as the two are not interchangeable); then, that could lead to a 10% reduction in aviation emissions.
[11] Reducing
[11a] Low-hanging fruit
Airport emissions: Data on airports’ emissions from onsite vehicles, electricity, heating, and cooling (scope 1&2 emissions) at 2% is retrieved from ACI Europe (2022) (page 3).
Aircraft ground operations: Total emissions under airport control at 5% (including scope 1&2 and aircraft ground operations); therefore, ground operations account for 3%. Retrieved from ITF (2021) (page50).
Air traffic management (ATM): Potential savings at 5%-10% retrieved from ITF (2021) (page 53, section air traffic management harmonization programmes). This is given in the European context for the year 2035, from the SESAR joint undertaking, and assumed to be of similar magnitude globally.
Therefore, 2% are attributed to scope 1&2 emissions, 3% are attributed to aircraft ground operations, and 5–10% attributed to air traffic management. For simplicity, 5% emissions under airport control and 5-10% ATM reductions potential are assumed to be achievable by 2050.
Aircraft fuel efficiency gains: To estimate the emissions reductions in 2050 from improvements in aircraft fuel efficiency the following procedure was used:
- Annual efficiency improvements followed the assumptions in MPP (2022), which are in line with the International Civil Aviation Organization (ICAO) (2022) aspirations of 2%/year efficiency improvement to 2050.
- These efficiency gains are only applied to conventional planes operating with conventional jet fuel and/or SAFs, but not considered for hydrogen or battery-electric planes (i.e., on 69.5% of the fleet in 2050, see [11c] for more details).
- These efficiency gains encompass both aircraft and operational improvements. Operational improvements are assumed to cover ATM and ground operations improvements discussed in the points before.
- A constant 1.5%/year improvement from 2019-2022 was assumed, followed by a 1.5%/year – 2%/year linear increase in fuel efficiency improvements from 2022 – 2030, followed by a constant 2%/year improvement to 2050.
- This leads to a total emissions reduction of ~33%. A part of these reductions comes from operational improvements and ATM (8 – 13%) and the remaining 20 – 25% come from aircraft and engine improvements such as retrofits, new engines, improved aircraft designs, improved aerodynamics etc…
[11b] Non-CO2 emissions – Rerouting
Several sources have reported that a small percentage of flights are responsible for most contrails:
Roger Teoh et al. (2022) found that about 12% of flights over the North Atlantic form approximately 80% of all the contrails in the region.
Roger Teoh et al. (2020) also found that 2% of all flights in the Japanese airspace form approximately 80% of contrails in the region.
In an article by Kyle Arnold (2022) quoting Delta Airlines, about 10% of aircraft flying at altitudes susceptible to contrail formation form persistent contrails.
Data on small diversions and 2% added fuel cost is from the joint research between Breakthrough Energy, American Airlines and Google Research by Carl Elkin & Dinesh Sanekommu (2023)
[11c] Technology
Based on range limitations, entry into service considerations, and potential share of travel of each technology as detailed in [8], the reductions in warming impact of these technologies were implemented as follows:
- If first 5.5% of aviation emissions were avoided via rail options (in the range up to 1500 km) as detailed in [10].
- Then, in travel emissions up to 500 km (~5.5%), we assume the best-case scenario where of the emissions not replaced by rail, 2% were covered by battery-electric flight (equally split between grid and green electricity supply).
- Next, up to 4000 km in range, 23% of travel could be covered via hydrogen aircraft (the remaining 2% of the 25% travel share detailed in [8] is now electric).
- In the range up to 4000 km:
- ~32% of travel emissions are for trips under 1500 km. ~5.5% of travel emissions are under 500 km, where 2% are made electric. Another 2% is covered by rail, for trips under 750 km, and 3.5% is covered by night rail for trips under 1500 km. This leaves the remaining 24.5% of emissions in this range.
- ~30% of travel emissions are for those between 1500 km to 4000 km. In this range rail, night rail, and electric flights are not considered a viable option.
- From the remaining 24.5% of emissions below 1500 km and 30% between 1500 km and 4000 km, 23% could be covered by hydrogen. Most of these flights would be <1500 km, and equally split between blue and green hydrogen for both hydrogen combustion and fuel cell aircraft.
- This leaves the remaining 31.5% of emissions in this range.
- Finally, 38% of emissions are for journey lengths over 4000 km. This 38% and 31.5% of emissions below 4000 km (total of 69.5% of emissions) could be covered by SAFs. The split between biofuels and green PtLs was assumed based on ReFuelEU’s sub-target of 35% of SAFs in 2050 to be supplied via green PtL fuels).
- Based on the above share of travel percentages of 2% electric (split between grid and green electricity), 23% hydrogen (split between green and blue hydrogen), and SAFs (split between biofuels and green PtLs) the sector wide reduced warming is calculated as the product of the travel share and warming reduction per flight as detailed in [9]).
- This metric gives the sector wide reduced warming potential if all conventional planes in operation in 2050 were replaced by an ambitious combination of electric, hydrogen and SAFs.
- What remains is the warming impact of these technologies due to upstream emissions, as well as in-flight non-CO2 emissions (in the case of hydrogen and SAF planes). Hydrogen flights were assumed to produce no contrails, as they were limited to shorter-haul flights, mostly <1500 km, where contrails are unlikely to form.
All emissions data over the different ranges were retrieved from ICCT (2020) (page 19, figure 9).
Reasonable travel share by technology was compared with MPP (2022) (Page 16).
[12] Our recommendations
Our own elaboration, based on research, a multitude of reports (MPP (2022), ITF (2021) Clean Air Task Force (CATF) (2023), ICCT (2020)), discussions, and the outcomes of The Aviation Chapter at Future Cleantech Architects’ The ARC Festival in June 2023.
List of references
IEA, Transport, https://www.iea.org/energy-system/transport
Our World in Data (2022), CO2 emissions, https://ourworldindata.org/co2-emissions
IEA (2022), CO2 emissions in 2022, https://www.iea.org/reports/co2-emissions-in-2022
ITF (2023), Transport Outlook 2023, https://doi.org/10.1787/5fc66b10-en
ITF (2023), ITF Transport Outlook statistics database, https://stats.oecd.org/Index.aspx?DataSetCode=ITF_OUTLOOK_2023_DOM_FREIGHT
David Lee et al. (2020), The contribution of global aviation to anthropogenic climate forcing for 2000 to 2018, https://doi.org/10.1016/j.atmosenv.2020.117834
Bernd Kärcher (2018), Formation and radiative forcing of contrail cirrus, https://doi.org/10.1038/s41467-018-04068-0
Meredith Colket et al (2017), Overview of the National Jet Fuels Combustion Program, https://doi.org/10.2514/1.J055361
Andreas Schafer et al (2018), Technological, economic and environmental prospects of all-electric aircraft, http://dx.doi.org/10.1038/s41560-018-0294-x
Sustainable Aero Lab, Bridging the Gap to 2050: How to Decarbonize Aviation Faster with Today’s Technologies, https://www.sustainable.aero/bridging-the-gap-2050
Aviation Impact Accelerator, https://recce.aiatools.org/
ITF (2021), Decarbonizing air transport: acting now for the future, https://www.itf-oecd.org/sites/default/files/docs/decarbonising-air-transport-future.pdf
ICCT (2020), CO2 emissions from commercial aviation, https://theicct.org/publication/co2-emissions-from-commercial-aviation-2013-2018-and-2019/
MPP (2022), Making Net-Zero Aviation Possible, https://missionpossiblepartnership.org/wp-content/uploads/2023/01/Making-Net-Zero-Aviation-possible.pdf
IATA (2022), 2022 SAF Production Increases 200% – More Incentives Needed to Reach Net Zero, https://www.iata.org/en/pressroom/2022-releases/2022-12-07-01/
IEA (2023), ETP Clean Energy Technology Guide, https://www.iea.org/data-and-statistics/data-tools/etp-clean-energy-technology-guide
IEA (2021), Net zero by 2050 A Roadmap for the Global Energy Sector, https://www.iea.org/reports/net-zero-by-2050
Back on Track EU, (2022), The Global Warming Reduction Potential of Night-Trains, https://back-on-track.eu/the-global-warming-reduction-potential-of-night-trains/
Stefan Gössling et al. (2020), The global scale, distribution and growth of aviation: Implications for climate change, https://doi.org/10.1016/j.gloenvcha.2020.102194
ACI Europe (2022), Guidance on airports’ contribution to net zero aviation, https://www.aci-europe.org/downloads/resources/ Guidance on Airports Contribution to Net Zero Aviation.pdf
ICAO (2022), Environmental Trends in Aviation to 2050, https://www.icao.int/environmental-protection/Documents/EnvironmentalReports/2022/ENVReport2022_Art7.pdf
Roger Teoh et al. (2022), Aviation contrail climate effects in the North Atlantic from 2016 to 2021, https://doi.org/10.5194/acp-22-10919-2022
Roger Teoh et al. (2020), Mitigating the Climate Forcing of Aircraft Contrails by Small-Scale Diversions and Technology Adoption, https://doi.org/10.1021/acs.est.9b05608
Kyle Arnold (2022), Airlines are finally admitting contrails are an environmental problem, https://phys.org/news/2022-12-airlines-contrails-environmental-problem.html
Carl Elkin & Dinesh Sanekommu (2023), How AI is helping airlines mitigate the climate impact of contrails (2023), https://blog.google/technology/ai/ai-airlines-contrails-climate-change/
Future Cleantech Architects (2023), The ARC Festival, https://arc-festival.org/aviation-chapter-arc2023/
Rocio Gonzalez Sanchez CATF (2023), Non-CO2 Climate Impacts of
Aviation: Contrails, https://www.catf.us/resource/non-co2-climate-impacts-aviation-contrails/
Aviation's Hidden Warming Impact: An Overview of Contrails
More than 60% of aviation’s impact on global warming comes from non-CO2 emissions, with contrails making the largest contribution (>50%).
These condensation trails, better known as contrails, can reflect a marginal amount of the sun’s incoming solar radiation back into space during the day. However, they are better at trapping a large amount of radiation coming from the earth’s surface and blocking it from leaving. Therefore, contrails have a net warming effect on the planet.
To truly put the aviation sector on a more sustainable path, it is not enough to tackle CO2 emissions. Non-CO2 emissions, particularly contrails, must also be addressed. Learn more about contrails, how to eliminate them, and our recommendations in our blogpost!
Deep dives

Aviation accounts for 2-3% of all global CO2 emissions and is the fastest growing emitter in the transport sector
However, this does not give the full picture of aviation’s impact on the climate. Taking into account aviation’s non-CO2 effects, the industry accounts for 3.5% of global effective radiative forcing, i.e. 3.5% of global warming, with the largest contributor to its warming effect being contrails.
To help the industry overcome its reliance on conventional jet fuel, both alternative fuels and revolutionary aircraft designs are necessary. Additionally, to further help minimize the sector’s warming impact on the planet, technological innovation should extend beyond the aircraft itself to encompass airport operations as well as flight path optimization and rerouting for contrail avoidance. Therefore, to be able to fly more sustainably, we require a holistic transformation of the sector that takes into account both CO2 and non-CO2 effects.

Long-haul flights make up almost 40% of the sector's emissions, although they only account for 5% of all flights.
When it comes to aviation, there is no one-size-fits-all solution for decarbonizing different flight ranges. Different technologies will be suitable depending on journey length.
✅ Currently, flights < 500 km and with < 100 passengers are most suited for battery-electric flight.
✅ A portion of short and medium-haul flights could be covered by hydrogen combustion, fuel cell, and hybrid aircraft.
❕ However, electric and hydrogen based technologies are still in the testing phase and primarily focus on smaller planes (responsible for ~ 4% of the industry’s annual emissions). For hydrogen aircraft, additional challenges include sourcing, transporting, and storing the hydrogen.
✅ For long haul flights, the only currently viable solution is synthetic aviation fuels (SAFs), including biofuels and e-fuels.
❕ Unfortunately, SAFs remain expensive and difficult to scale. While production has been increasing over the past 5 years, the amount of SAFs produced in 2022 only covered ~0.1% of the industry’s fuel consumption.
Most conventional batteries are great at delivering power, which is useful for rapid, short-term fluctuations in the electrical grid. However, they are not able to economically deliver large quantities of energy, which is necessary to tackle seasonal fluctuations.
Other long duration energy storage (LDES) technologies, such as pumped hydro, thermal energy storage, and power-to-gas, are much better at storing large amounts of energy. Hence, they will be needed in applications that require electricity over long periods of time, ranging from 10 hours to seasonal. Pumped hydro, in particular, is the most mature and widespread grid-scale storage technology and will continue to dominate global energy capacity in the near future.

The aviation sector is quickly running out of time
Every year, several thousand new planes enter service and remain operational for 20-30 years – a lifetime that can be extended further with proper maintenance and care.
What does this mean for the global aviation fleet?
Most planes sold in the coming decade are expected to remain conventional. These conventional planes, although more efficient than current models, will remain operational up to 2050. This is because planned electric and hydrogen planes are currently still in the testing phase, focusing on smaller aircraft with limited range.
This constitutes a big challenge, especially when looking at long-haul flights, responsible for ~40% of emissions from commercial aviation, where alternatives are not readily available. Additionally, airport infrastructure and personnel training would need to start adapting to these novel aircraft technologies today, in order not to further delay their entry into service.
Breakthrough technologies on their own cannot get the sector to net zero by 2050. However, they have a role to play in a larger holistic approach to decarbonizing the aviation sector.

The aviation sector is not on track for net zero by 2050
Why is it so difficult to get the aviation sector on a more sustainable path? Some of the key challenges are:
🔶 International flights make up more than 50% of the sector’s emissions, even though 2/3 of flight departures are domestic. This poses severe challenges when trying to regulate these emissions. To truly reduce emissions, international cooperation that prioritizes the environment is paramount.
🔶 Time is running out fast for the sector: Aircraft built today will remain in service for the next 25 years. However, today’s airplanes are still predominantly built and optimized to operate on conventional jet fuel. Entry into service of electric or hydrogen aircraft is not expected before the second half of this decade.

The aviation sector is not on track for net zero by 2050
2020 saw a 60% drop in flight demand due to COVID-19. However, demand is bouncing back, already at 70% of pre-pandemic levels in 2022, and by 2025, demand is expected to hit 2019 levels again.
The outlook for 2050? Demand is set to more than double compared to 2019 levels.
National and regional governments are committed to decarbonizing the aviation sector. Initiatives like ReFuelEU and the USA’s SAF Grand Challenge will play a pivotal role in decreasing aviation’s emissions.
As measures such as blending mandates and carbon pricing start to kick in, we will see demand growth and emissions decouple. By 2050, despite doubled demand, CO2 emissions will drop by ~20% compared to 2019 levels based on current announced policy ambitions.
To steer the aviation sector onto a more sustainable path, however, we will need more local, regional, and international efforts that also consider aviation’s non-CO2 emissions.
Solar and wind energy fluctuate and are not available on demand. However, supply and demand must match at all times. This means that flexible sources are needed to balance the fluctuations.
Currently, flexibility is mostly provided by either burning fossil fuels (i.e. gas peaker plants) or hydropower stations. However, fossil fuels need to be phased out and hydropower is not universally available. In many cases, new low-carbon flexibility tools, such as long duration energy storage (LDES), will be required to minimize curtailment and fill in production gaps within daily, weekly, and seasonal timeframes.
LDES is one of the most crucial pieces of the energy flexibility puzzle, specially for countries reaching high shares of wind and solar power. By incorporating LDES into the grid, utilities can better manage the balance between supply and demand, improve energy security and reduce curtailment (waste of excess production) of renewable sources.