Hydrogen and Climate Change – All you need to know
The Basics & The Gaps is the Future Cleantech Architects flagship series of factsheets and animations which aims to summarise the key facts and figures on some of the most challenging issues and technological innovations needed to reach net-zero.
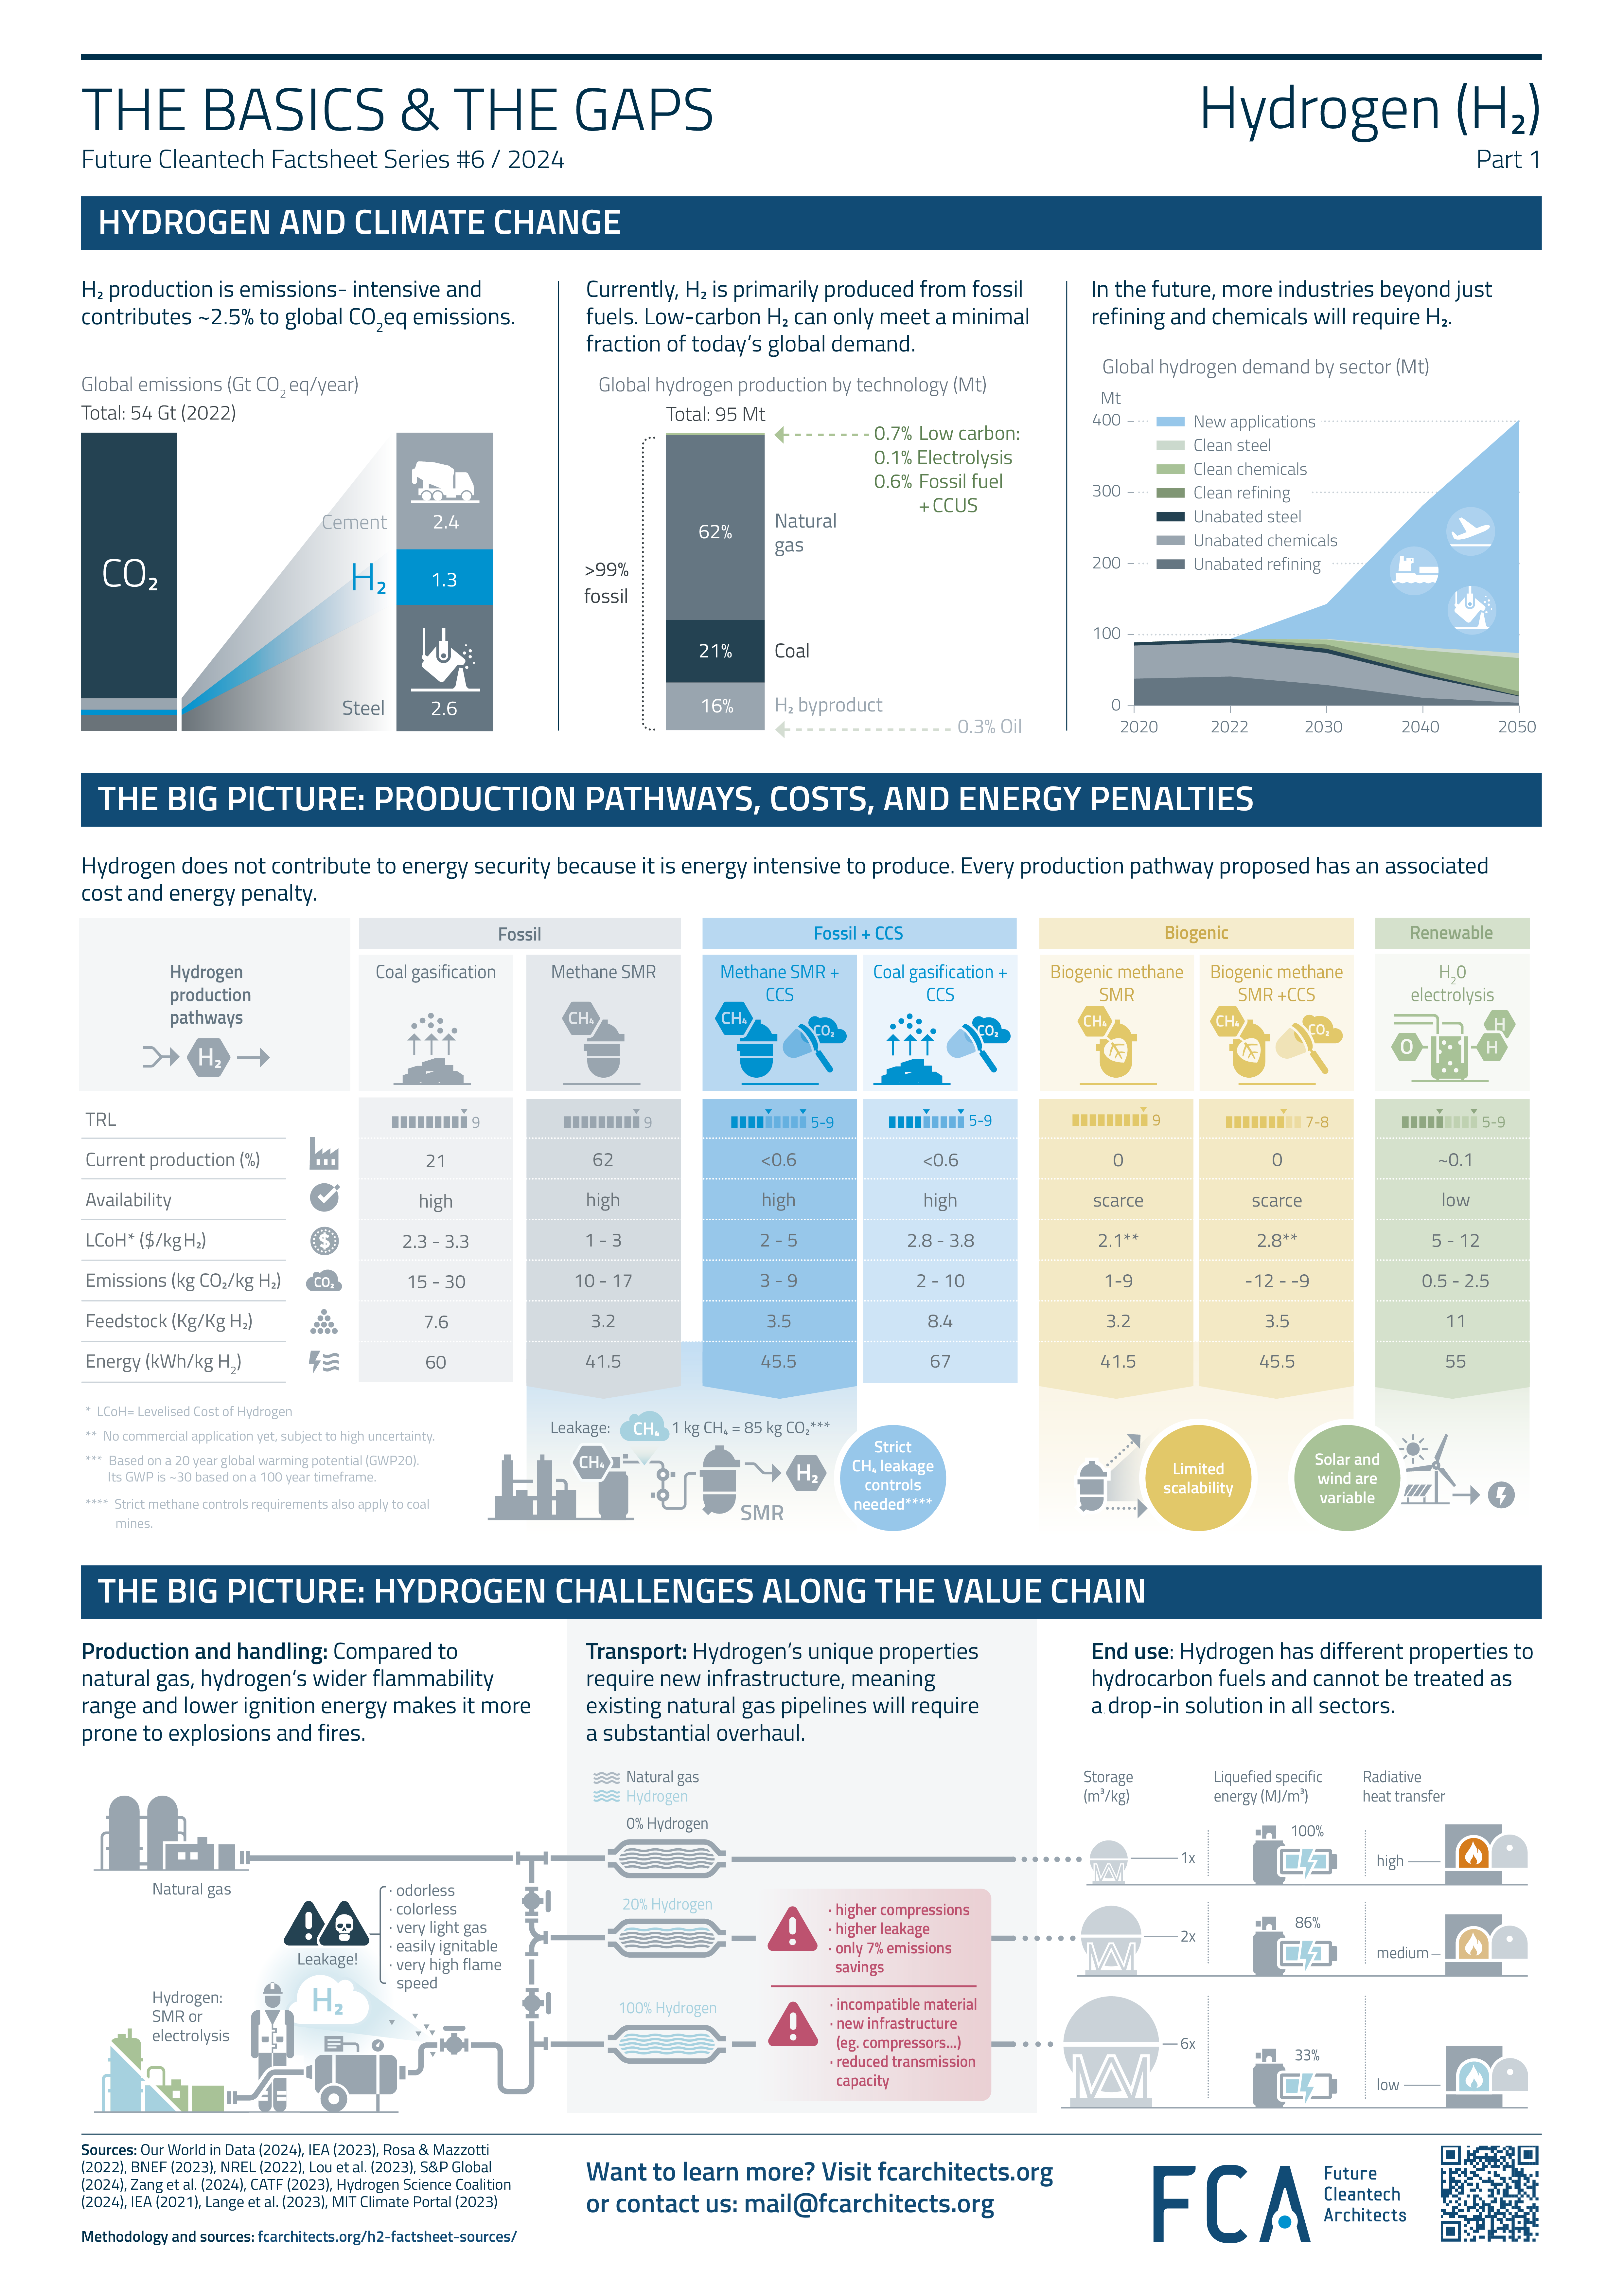
Hydrogen production is highly emissions-intensive and contributes 2.5% to global CO₂,eq emissions annually. Producing hydrogen is a carbon intensive process that is still heavily reliant on fossil fuels, with over 55 Mt coming from natural gas via steam methane reforming.
Green hydrogen will play a key role in decarbonizing hydrogen production because it is chemically identical to hydrogen but is not produced from fossil fuels. The main way to produce green hydrogen currently is via electrolysis of water powered by renewable electricity. While efforts to ramp up green hydrogen production are underway, electrolyzer technology remains too costly to scale effectively. See our newly released factsheet to learn more about hydrogen production, its challenges, and how to prioritize it for the different sectors!


Show sources
Methodology
[1] Hydrogen and global emissions
Global CO2,eq emissions at 54 Gt for 2022 were retrieved from Our World in Data (2024), ”Greenhouse gas emissions”.
The share of global CO2,eq emissions from hydrogen in 2022 was ~1.3 Gt CO2.eq, equivalent to ~2.5% of global annual emissions, retrieved from the International Energy Agency (IEA) (2023), ”Hydrogen” (CO2 emissions section).
CO2 emissions from industry in 2022 were retrieved from IEA (2023), ”Industry” (CO2 emissions section) with 2.6 Gt from iron and steel and 2.4 Gt from cement.
[2] Hydrogen global production
Global hydrogen production at 95 Mt and the breakdown of hydrogen production by technology in 2022 were retrieved from the IEA (2023), “Global Hydrogen Review 2023”. Natural gas is the main source of hydrogen production at 62%, via steam methane reforming, followed by coal and by-product hydrogen at 21% and 16% respectively. Hydrogen via electrolysis and hydrogen from fossil fuels with carbon capture utilization and storage (CCUS) contribute less than 1% to global production, with 0.1% from the former and 0.6% from the latter. The remaining 0.3% of the production comes from oil (not shown in the diagram).
[3] Hydrogen current and future demand
Data for hydrogen current and projected demand, including for projected novel applications, was retrieved from the IEA (2023), ”Global hydrogen demand in the Net Zero Scenario, 2022-2050”. This data was then adapted into the graph for the current and projected future demand for hydrogen until 2050.
[4] The big picture: hydrogen doesn’t contribute to energy security
This diagram breaks down the key indicators of technologies currently in use, mainly fossil-based technologies such as unabated natural gas SMR and coal gasification, and potential clean technologies for the decarbonization of hydrogen production such as fossil + CCUS, biogenic hydrogen, and electrolysis. The following indicators are included in the diagram:
- Technology Readiness Levels (TRL): retrieved from the IEA (2023), “ETP Clean Energy Technology Guide“. TRLs for biogenic methane SMR with and without CCUS were retrieved from Rosa and Mazzotti (2022).
- Current production: rates for each technology were retrieved from the IEA (2023) ”Global Hydrogen Review 2023”.
- Availability: a qualitative metric for availability was determined based on feedstock: where sources of biogenic methane remain scarce and renewable electricity availability remains low. Electrolyzers are another limiting factor when it comes to green hydrogen.
- Levelized cost of hydrogen (LCoH): for the LCoH in $/kg of H2, for methane SMR, methane SMR + CCUS, and green hydrogen, was retrieved from Bloomberg New Energy Finance (BNEF) (2023), ”Green Hydrogen to Undercut Gray Sibling by End of Decade”. The LCoH was reported in ranges as it varies based on the region. As fewer regions utilize coal, the range was not as wide for coal gasification with or without CCUS, which was taken for the USA and retrieved from the National Renewable Energy Laboratory (NREL) (2022), ”Comparison of commercial, state-of-the-art, fossil-based hydrogen production technologies”. As there is no current commercial hydrogen production via the biogenic methane SMR pathway, with or without CCUS, average costs were reported based on the literature from Lou et al. (2023). However, these costs are subject to high uncertainty with current renewable natural gas prices over ten times those of natural gas as outlined in S&P Global (2024), ”Renewable natural gas and hydrogen: fuels of the future for transportation decarbonization”.
- Emissions: CO2 emissions in kg CO2/kg H2 for the various technologies were reported based on the low and high emissions ranges given in Rosa and Mazzotti (2022).
- Feedstocks: coal, methane, and water feedstock requirements to produce 1 kg of H2 were retrieved from NREL (2009), ”Hydrogen Resource Assessment”. While coal requirements were reported in kg in the assessment, methane was reported as 4.5 normal cubic meters per kg of H2, which converts to 3.2 kg of methane, and water was reported as 3 gallons, which corresponds to ~11 kg. The assumption was made that an extra ~10% of fossil feedstock would be needed when implementing SMR + CCUS or gasification + CCUS due to the energy penalties associated with carbon capture. This is in agreement with the literature, such as the paper by Zang et al. (2024), which reported an 8% extra natural gas consumption when CCUS was employed with SMR. It was assumed that the feedstock requirements for biogenic methane with and without CCUS would be identical to fossil methane.
- Energy: the energy needed was reported based on the feedstock required to produce a kg of H2 in kWh/kg H2. For methane, based on its lower heating value (LHV) of 13 kWh/kg, the energy requirements were calculated to be 41.5 kWh/kg H2 and 45.5 kWh/kg H2 without and with CCUS respectively. These numbers were assumed identical for biogenic methane SMR with and without CCUS. For coal, based on an LHV of 8 kWh/kg, the energy requirements were calculated to be 60 kWh/kg H2 and 67 kWh/kg H2 without and with CCUS respectively. As for hydrogen electrolysis, the energy requirements were estimated based on the 33.3 kWh/kg LHV and 60% electrolyzer efficiency (equivalent to 70% efficiency based on hydrogen’s higher heating value (HHV) of 39.4 kWh/kg), which leads to an energy requirement of 55 kWh/kg. LHVs and HHVs were retrieved from The Engineering ToolBox (2003), ”Fuels - Higher and Lower Calorific Values”. Electrolyzer efficiency is compatible with efficiencies used by Clean Air Task Force’s (CATF) (2023), ”Hydrogen for Decarbonization” and Hydrogen Science Coalition (2024), ”Putting facts into perspective on hydrogen’s role in the energy transition”.
Methane’s global warming potential (GWP) over a 20-year and 100-year period is ~30 and ~85 as reported in the IEA (2021), ”Methane and climate change”.
The variability of renewables reduces the CAPEX utilization of the electrolyzers. It also entails ramping up and down electrolyzers, which is technically feasible depending on the type of electrolyzer being used. For further details see Lange et al. (2023). Additionally, the hydrogen’s end use dictates whether a continuous supply of hydrogen is required (for example, in the case of e-fuel production).
[5] The big picture: hydrogen is not a silver-bullet solution
This diagram was developed to reflect the challenges in hydrogen handling, transportation, and utilization.
- Hydrogen production and handling: information on hydrogen safety and handling was retrieved from Hydrogen Tools (2024), “Best Practices”.
- Hydrogen transport: data on hydrogen blending and emissions savings was retrieved from the Hydrogen Science Coalition (2024), ”Putting facts into perspective on hydrogen’s role in the energy transition”. Information on hydrogen incompatibility with existing natural gas infrastructure was retrieved from MIT Climate Portal (2023), ”Can we use the pipelines and power plants we have now to transport and burn hydrogen, or do we need new infrastructure?”.
- Hydrogen end use: the comparative storage space required for 100% natural gas, a blend of 20% hydrogen and 80% natural gas, and 100% hydrogen was based on the densities of both molecules, where compressed hydrogen at 500 bar is six times lighter than compressed natural gas at 250 bar. Specific energy for liquid natural gas and liquid hydrogen was used to compare the energy content per unit volume of 100% natural gas, a blend of 80% natural gas and 20% hydrogen, and 100% hydrogen where hydrogen’s specific energy is 1/3 that of natural gas. Data on densities and specific energy are outlined in CATF (2023), ”Hydrogen for Decarbonization”. Finally, a qualitative depiction of the color of the flames is used to reflect the radiative heat transfer properties of the resulting flames. Radiative heat transfer is important for heat distribution to the flame’s surroundings. One key characteristic of hydrogen flames is their lower radiative heat transfer capabilities mainly due to the lack of carbon in the fuel that leads to combustion products (water vapor) with differing radiative properties from soot and CO2. Additionally, the lack of soot, which enhances radiative heat transfer, also diminishes a hydrogen flame’s radiative properties. The burner or furnace would need to be adapted for hydrogen use. Further information on hydrogen flames can be found in Hydrogen Tools (2024), ”Best Practices”.
[6] Hydrogen prioritization: current hydrogen demand and the need to decarbonize
Current and projected hydrogen demand were retrieved from the IEA (2023), ”Global hydrogen demand in the Net Zero Scenario, 2022-2050”. Three simplified process flow diagrams were developed to depict the current main use cases for hydrogen for fertilizers, refineries, and steel and how these processes can be altered to supply clean hydrogen to decarbonize.
- Fertilizer: the diagram for the urea production pathway, the most common fertilizer, which is dependent on ammonia as a precursor, was created from data available in the IEA (2021), ”Ammonia Technology Roadmap” and Ding et al. (2023). Emissions data from hydrogen production dedicated to ammonia was retrieved from the IEA (2023), ”Global Hydrogen Review 2023”. Data on the global dependence on fertilizer for sustained food production was retrieved from Our World in Data (2017), ”How many people does synthetic fertilizer feed?”.
- Refineries: the diagram for the fuel production pathway via refineries was created with data from the IEA (2023), ”Global Hydrogen Review 2023” including emissions data from hydrogen production dedicated for use in refineries and the hydrogen usage distribution: that which is purchased from merchants, produced on-site, and produced as a byproduct from refinery processes.
- Iron and Steel: the pathway for producing steel through the direct reduced iron (DRI) and electric arc furnace was created with reference to the pathways depicted in Roland Berger (2020), ”The future of steelmaking”. CO2 emissions from iron and steel at 2.6 Gt in 2022, dependence on coal, and scrappage rates were retrieved from IEA (2023), ”Steel” (CO2 emissions, Energy, and Technology deployment sections).
[7] Hydrogen prioritization: viable use in new sectors
Two main viable new sectors were identified as long-distance aviation and shipping following Liebreich (2023), ”Clean Hydrogen Ladder, version 5.0”. The projected hydrogen demand was retrieved from the IEA (2023), ”Global hydrogen demand in the Net Zero Scenario, 2022-2050”. Simplified process flow diagrams were developed depicting the current refinery pathway for jet fuel and fuel oil production as well as the decarbonized pathways to produce hydrogen, biojet fuel and biofuel oil, sustainable jet fuel, and alternative sipping fuels (such as methanol and ammonia), for aviation and shipping. Potential alternative fuel options for aviation and shipping were taken from ITF (2023), ”The Potential of E-fuels to Decarbonise Ships and Aircraft”.
Representative data on the approximate amount of hydrogen needed per kilogram of fuel produced was retrieved from studies assessing the pathways to produce these fuels:
- Jet fuel, fuel oil, biojet fuel, and biofuel oil hydrogen requirements were estimated based on the conservative assumption that hydrogen will be needed for the intermediate product to undergo both hydrocracking, requiring 300 Nm3 H2/tonne of product, and hydrotreating, requiring 50 Nm3 H2/tonne of product, as outlined in The European Hydrogen Observatory (2021), ”2021 Hydrogen Supply and Demand”.
- Synthetic jet fuels’ hydrogen requirement was taken from Atsonios et al. (2023).
- Green ammonia hydrogen requirement was taken from Pagani et al. (2024).
- E-methanol hydrogen requirement was taken from Sollai et al. (2023).
[8] Hydrogen prioritization: incompatible sectors
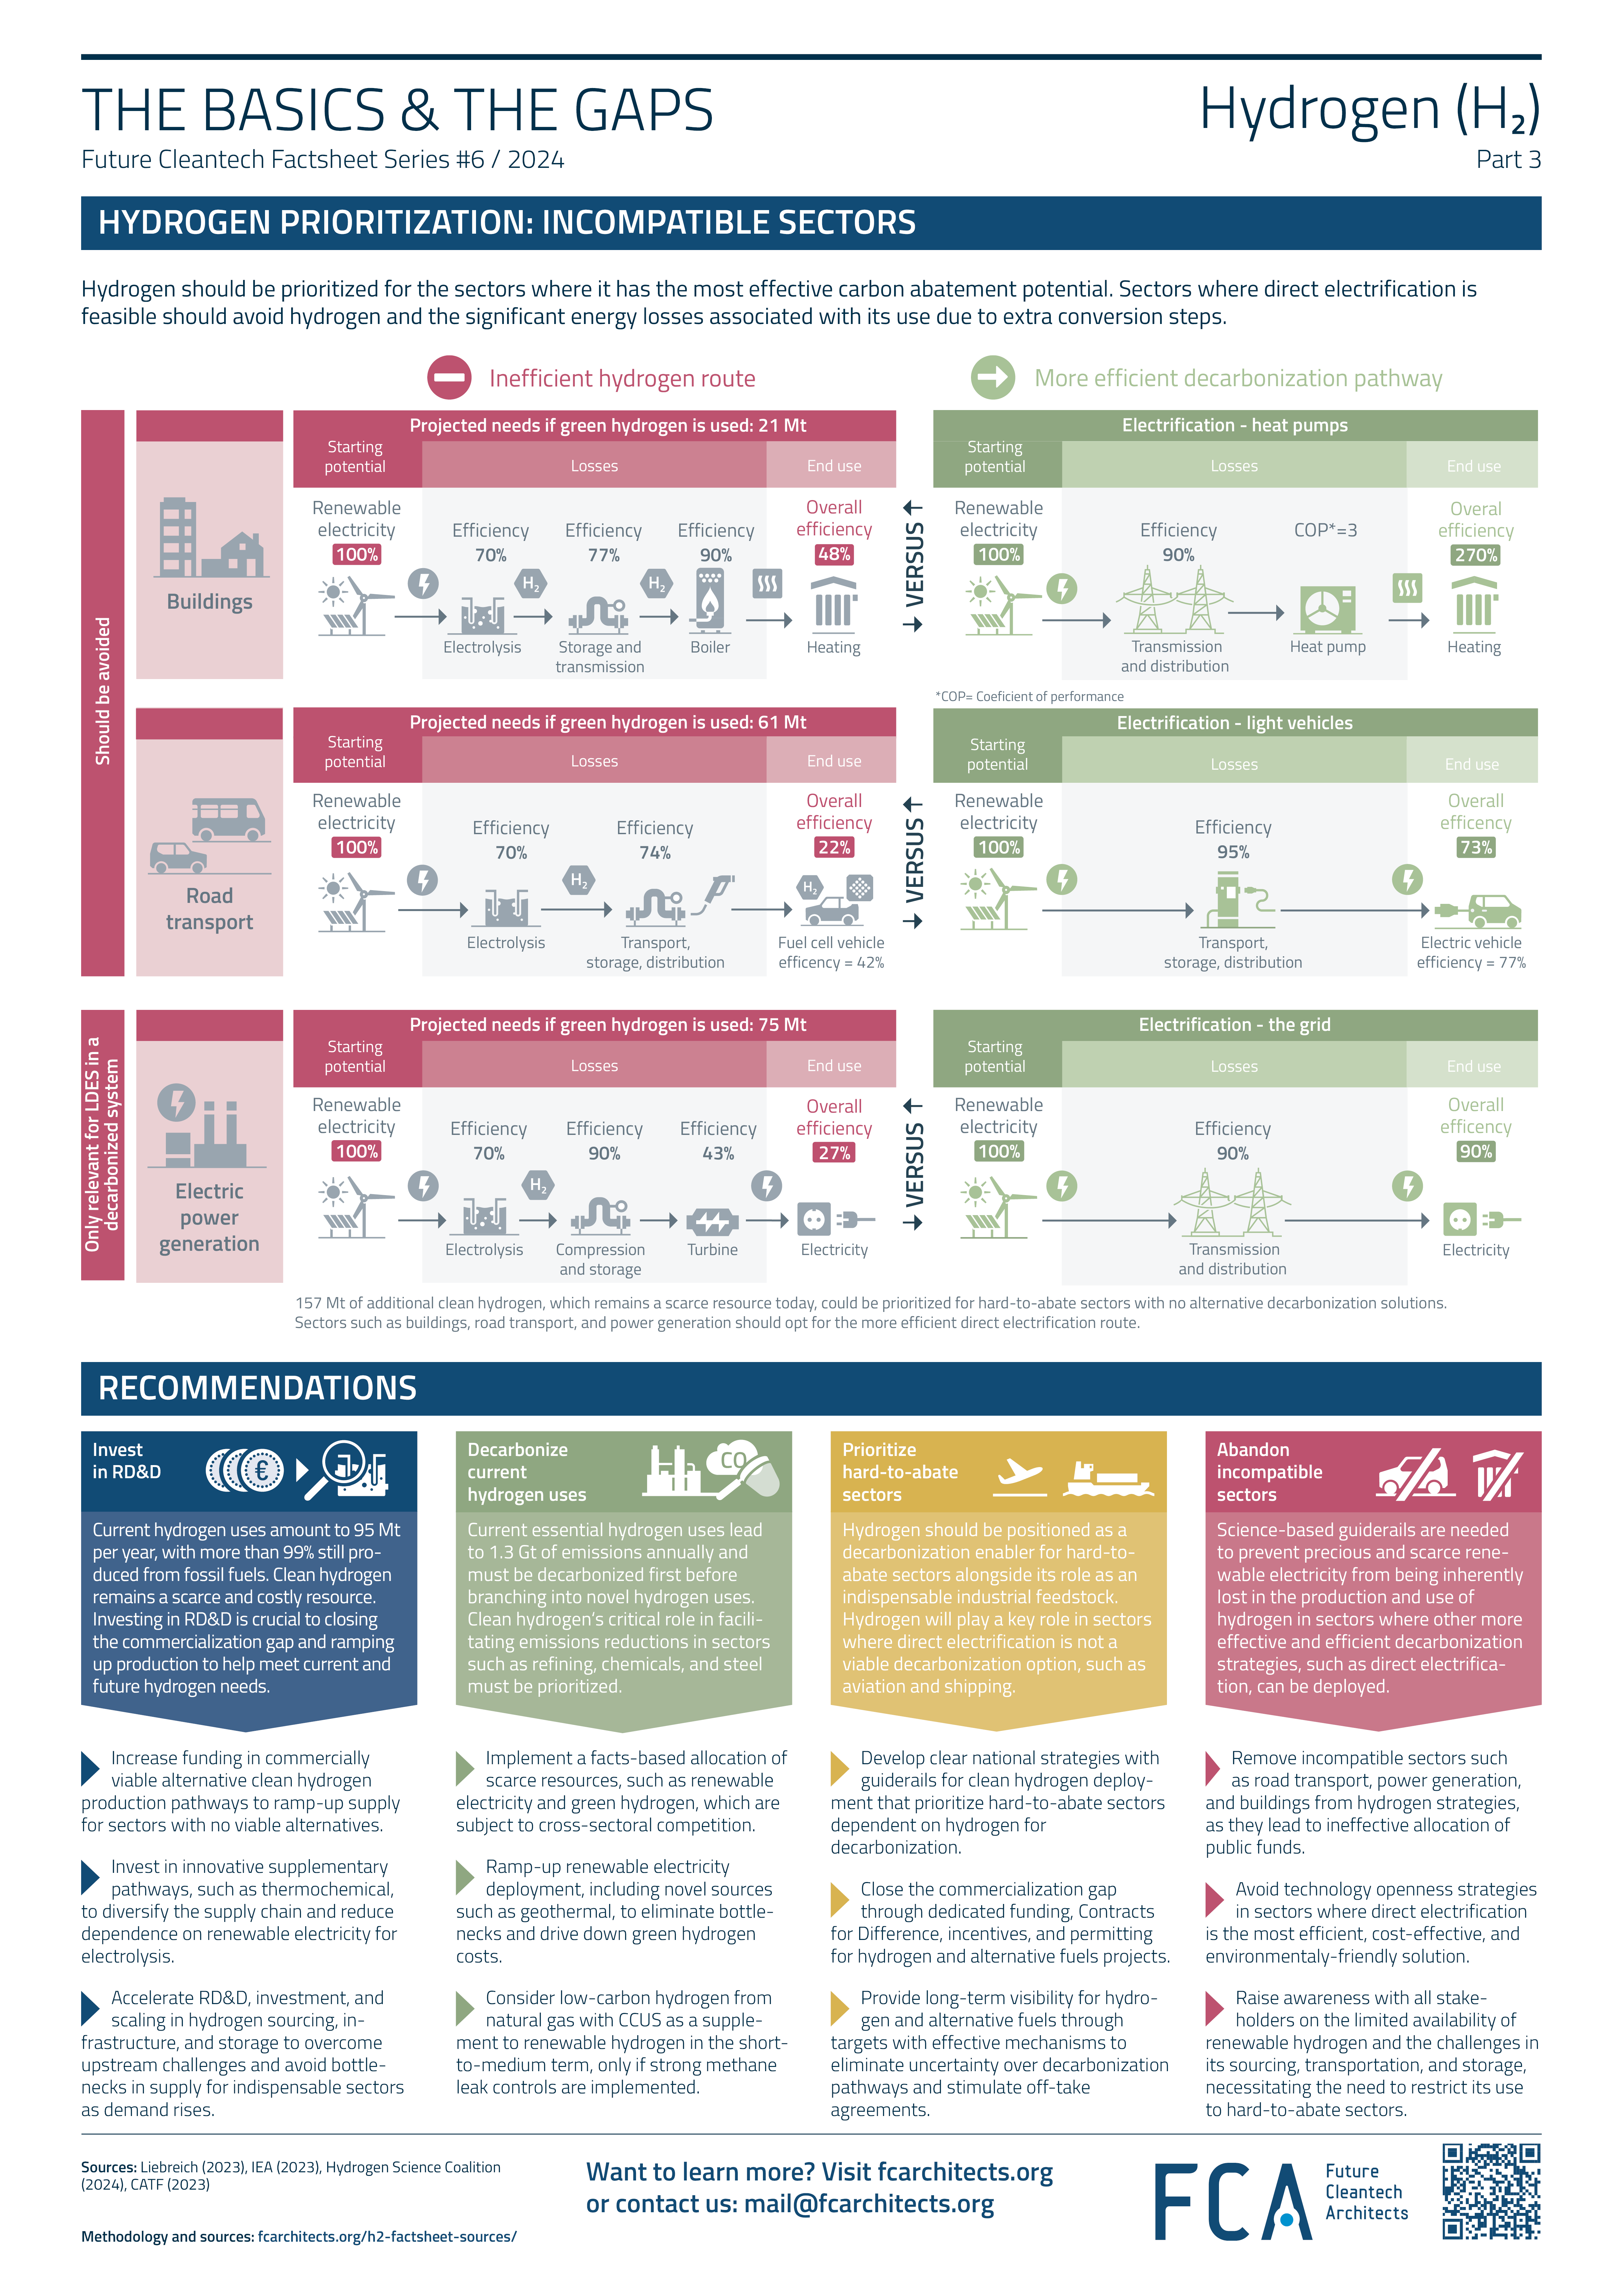
The main hydrogen-incompatible sectors identified were buildings, road vehicles, and power generation following Liebreich (2023), ”Clean Hydrogen Ladder, version 5.0”. The projected hydrogen needs for the three sectors in 2050 were retrieved from the IEA (2023), ”Global hydrogen demand in the Net Zero Scenario, 2022-2050”.
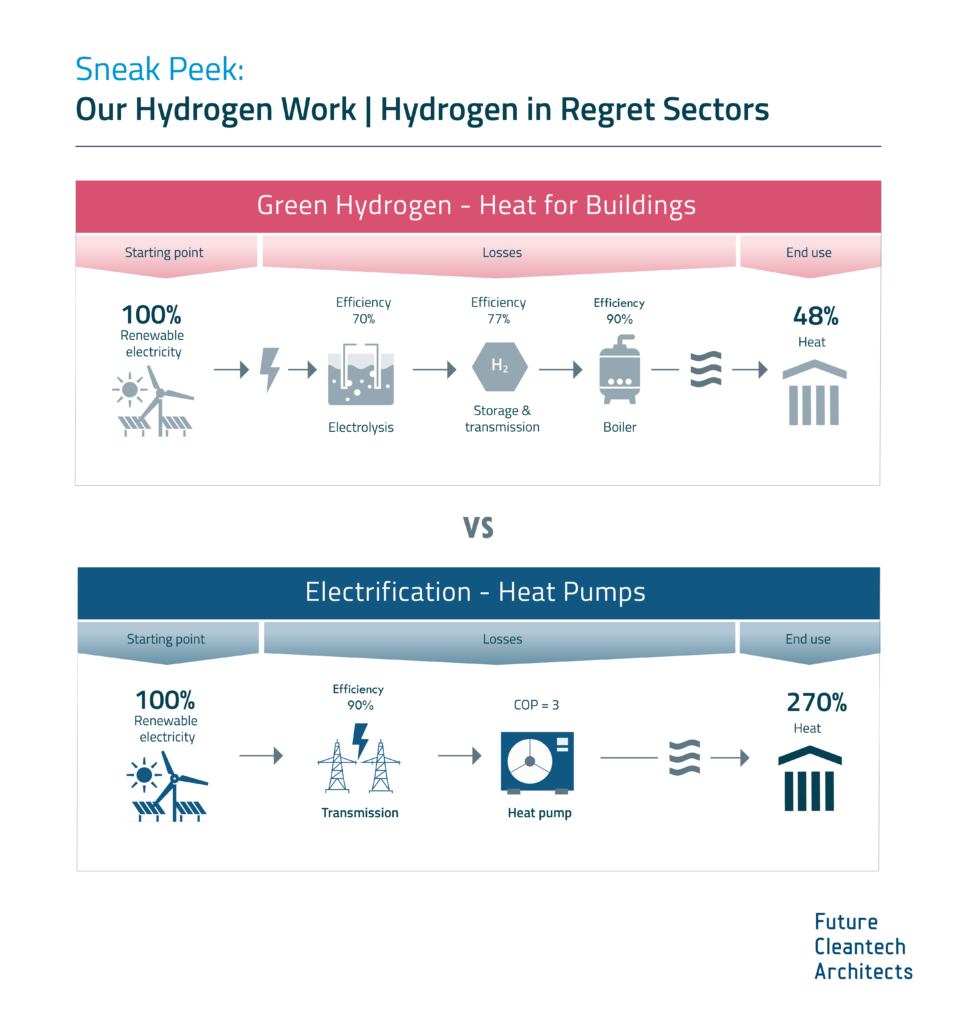
The diagram was developed to show the efficiency of providing heat for buildings, electricity for road vehicles, or generating electricity for consumption via a hydrogen route and to compare it to the alternative more efficient direct electrification route for each sector as follows:
- Buildings: the diagram depicts that generating heat for buildings through hydrogen has a conversion efficiency along the value chain that is ~5.6 times lower than generating heat through heat pumps. Data for the efficiencies at every conversion step was collected from the Hydrogen Science Coalition (2024), “Putting facts into perspective on hydrogen’s role in the energy transition”.
- Road transport: the diagram reveals that operating a hydrogen fuel cell vehicle is ~3.3 times less efficient, when accounting for all conversion losses along the value chain, compared to a battery electric vehicle. Data for the efficiencies at every conversion step was collected from the Hydrogen Science Coalition (2024), ”Putting facts into perspective on hydrogen’s role in the energy transition”.
- Electric power generation: the diagram illustrates that hydrogen generation is ~3.3 times less efficient than the direct transmission of renewable electricity through the grid. Data for the efficiencies at every conversion step for the hydrogen route was collected from CATF (2023), ”Hydrogen for Decarbonization”. The direct electrification route was developed based on the transmission and distribution losses identified in the heat pumps pathway from the Hydrogen Science Coalition (2024), ”Putting facts into perspective on hydrogen’s role in the energy transition”.
[9] Recommendations
Policy recommendations have been developed from FCA’s own recommendations, expanding upon version 1.0 of the hydrogen factsheet, and based on interactions with stakeholders and policymakers. Policy recommendations have been collected and adapted from the additional following sources: IEA (2023), ”Global Hydrogen Review 2023”, Liebreich (2023), ”Clean Hydrogen Ladder, version 5.0”, CATF (2023), ”Hydrogen for Decarbonization”.
Summary list of sources:
Our World in Data (2024), ”Greenhouse gas emissions”.
IEA (2023), ”Hydrogen” (CO2 emissions section).
IEA (2023), ”Industry” (CO2 emissions section).
IEA (2023), ”Global Hydrogen Review 2023”.
IEA (2023), ”Global hydrogen demand in the Net Zero Scenario, 2022-2050”.
IEA (2023), “ETP Clean Energy Technology Guide“.
Rosa and Mazzotti (2022), ”Potential for hydrogen production from sustainable biomass with carbon capture and storage”.
BNEF (2023), ”Green Hydrogen to Undercut Gray Sibling by End of Decade”.
NREL (2022), ”Comparison of commercial, state-of-the-art, fossil-based hydrogen production technologies”.
Lou et al. (2023), ”The potential role of biohydrogen in creating a net-zero world: the production and applications of carbon-negative hydrogen”.
S&P Global (2024), ”Renewable natural gas and hydrogen: fuels of the future for transportation decarbonization”.
NREL (2009), ”Hydrogen Resource Assessment”.
Zang et al. (2024), “H2 production through natural gas reforming and carbon capture: A techno-economic and life cycle analysis comparison”.
The Engineering ToolBox (2003), ”Fuels - Higher and Lower Calorific Values”.
CATF (2023), ”Hydrogen for Decarbonization”.
Hydrogen Science Coalition (2024), ”Putting facts into perspective on hydrogen’s role in the energy transition”.
IEA (2021), ”Methane and climate change”.
Lange et al. (2023), “Technical evaluation of the flexibility of water electrolysis systems to increase energy flexibility: A review”.
Hydrogen Tools (2024), “Best Practices”.
MIT Climate Portal (2023), ”Can we use the pipelines and power plants we have now to transport and burn hydrogen, or do we need new infrastructure?”.
IEA (2021), ”Ammonia Technology Roadmap”.
Ding et al. (2023), ”Direct synthesis of urea from carbon dioxide and ammonia”.
Our World in Data (2017), ”How many people does synthetic fertilizer feed?”.
Roland Berger (2020), ”The future of steelmaking”.
IEA (2023), ”Steel” (CO2 emissions, Energy, and Technology deployment sections).
Liebreich (2023), ”Clean Hydrogen Ladder, version 5.0”.
ITF (2023), ”The Potential of E-fuels to Decarbonise Ships and Aircraft”.
The European Hydrogen Observatory (2021), ”2021 Hydrogen Supply and Demand”.
Atsonios et al. (2023), ”Process analysis and comparative assessment of advanced thermochemical pathways for e-kerosene production”.
Pagani et al. (2024), ”Green hydrogen for ammonia production – A case for the Netherlands”.
Sollai et al. (2023), ”Renewable methanol production from green hydrogen and captured CO2: A techno-economic assessment”.
New content: Our work on Hydrogen applications!
Future Cleantech Architects is updating our work on Hydrogen and there will be an all-new Hydrogen Factsheet! This update will not only include current figures, but will also expand our assessment to the potentials and limitations of key hydrogen derivatives, such as ammonia, e-methanol, and synthetic natural gas. Stay tuned for more previews before the release in autumn!
Hydrogen must be prioritized for no-regret sectors as it is a scarce, desperately-needed chemical for several industries.
